Search

Beacon Object Files for Mythic – Part 1

Search

Beacon Object Files for Mythic – Part 1

November 19, 2025

Beacon Object Files for Mythic: Enhancing Command and Control Frameworks – Part 1

This is the first post in a series of blog posts on how we implemented support for Beacon Object Files into our own command and control (C2) beacon using the Mythic framework. In this first post, we will take a look at what Beacon Object Files are, how they work and why they are valuable to us.

The blog post series accompanies the master’s thesis “Enhancing Command & Control Capabilities: Integrating Cobalt Strike’s Plugin System into a Mythic-based Beacon Developed at cirosec” by Leon Schmidt and the related source code release of our BOF loader.

Introduction to C2 frameworks, Cobalt Strike and Mythic

If you are already familiar with the basics of C2, you can skip right ahead to What are Beacon Object Files and why do we need them?

C2 frameworks are a popular tool for bad actors to attack and infiltrate infrastructures and systems. They allow long-lasting inroads to be made into the infrastructure, through which attackers can interact with it through covert channels. These frameworks thus play a crucial role in cybersecurity and our day-to-day work at cirosec, enabling our red teams and penetration testers to simulate those real-world adversary tactics. The increasing complexity of modern cyber threats has driven the development of advanced C2 frameworks, such as Cobalt Strike and Mythic, which are widely used by threat actors and our red teamers alike.

The default C2 infrastructure

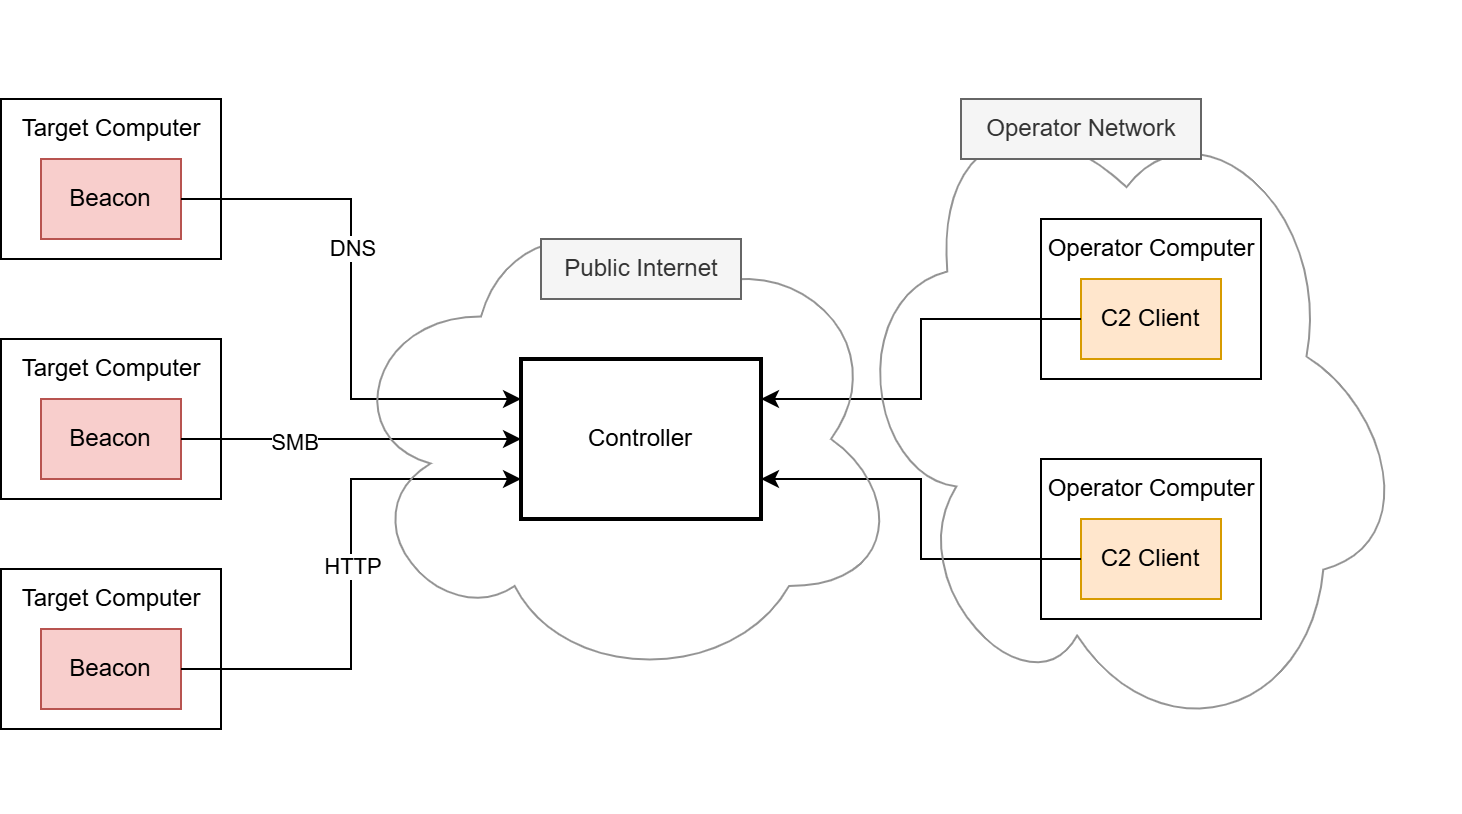
The C2 principle is implemented using two main components, the beacon (also known as the agent or implant) and the controller (also known as the team server).

The beacon is the component that is brought onto the compromised system using various delivery techniques, e.g. by using shellcode injection (we have developed our own shellcode loader to carry out delivery, which we have covered in a separate blog post series starting here, if you are interested). Once the beacon is launched, it connects back to the C2 infrastructure. Each new incoming connection from a beacon is usually referred to as a callback. The payload data transmitted through the callback is usually hidden and obfuscated by a so-called C2 profile. This C2 profile is implemented in both the beacon and the controller and defines the data format and the transport channel through which the payload data is sent. Usually, the HTTP protocol is employed for this, as it is frequently used for legitimate connections. It is rarely recognized as conspicuous in most environments and therefore rarely blocked. In some cases, other common network protocols such as DNS or SMB named pipes are misused to hide these messages. After the connection between the beacon and the controller is established, the red team can send commands to the beacon through this covert C2 channel.

The controller is the second important component, serving as the central control instance for the callbacks. The beacons and the controller must have a means of communication as otherwise no callbacks can be received. In the most basic C2 setup, this means that the controller must be directly accessible for all beacons deployed in the operation, but other, more complex setups are possible.

The controller is provided and administered by the red team. Depending on the C2 framework, the administration is carried out differently, for example via a web interface or a dedicated client.

A default C2 infrastructure, as described above, may look like this:

Figure 1: A default C2 infrastructure with three beacons, two clients and a C2 controller
Leon Schmidt

Consultant

Category
Date
Navigation

In this blog post series, we will focus on the Cobalt Strike and Mythic frameworks, which both work according to this principle.

Differences between Cobalt Strike and Mythic

Cobalt Strike – a widely used proprietary C2 framework – comes as a “battery included” solution. It contains a controller application to be set up on a Linux host as well as a pre-configured and pre-implemented beacon. The beacon payload can be generated in different formats, like an executable, shellcode or even as a Microsoft Word macro; however, each Cobalt Strike beacon payload is based on the same closed-source codebase.

In Mythic, there is virtually no coupling between the server and the beacon in terms of how the beacon must be designed. Mythic only contains the controller application and defines a set of interfaces to interact with it. The beacon can be developed freely using every programming language possible, as long as it implements at least one of the C2 profiles which interface with the Mythic server properly. This means, there cannot be a common feature set that both Mythic and its beacons can have. This is a huge drawback but also offers a high degree of flexibility: The beacons can adapt to every environment, which is why we decided to use Mythic at cirosec.

We have developed our own Mythic beacon, together with a custom C2 profile, to be used in our red teaming operations. As a result, our beacon is significantly less prevalent in virus databases and other products that search for malware based on file signatures or behavior, which is a major disadvantage of the Cobalt Strike beacon. However, there is a downside to using a custom-made beacon: Fortra, the company behind Cobalt Strike, is naturally continuing to diligently implement new features for its framework. Since we develop our own beacon for Mythic, we are unable to benefit from these features. One of these features, which was introduced back in 2020, recently caught our attention because it changed how operators interact with C2 beacons: Beacon Object Files.

What are Beacon Object Files and why do we need them?

Beacon Object Files, or BOFs for short, are compiled programs written to a convention that allows them to execute within the Cobalt Strike beacon process. They are a way to rapidly extend the beacon’s functionality with new post-exploitation features written in pure C code. It allows the beacon to be modified and extended after deployment since native features would need to be implemented beforehand. This would also result in a bigger size on disk, which may impede EDR evasion or the use of specific shellcode invocation techniques, such as the exploitation of Microsoft Warbird, which we have previously covered in another blog post. Native features can even be replaced by BOFs, which can further reduce the size on disk.

Running code within the beacon process, however, is nothing new in the C2 world. Many frameworks already offer the execution of PowerShell scripts, native PE files and .NET executables. The underlying techniques are usually less sophisticated, as they rely on existing functions of the Windows operating system – particularly the PE loader, the Common Language Runtime (CLR) for .NET executables or the PowerShell runtime. When launching executable programs, the operating system must provide a runtime in a separate process. This is known as “fork and run” and describes the creation of an auxiliary process as a child process (“fork”), in the context of which the program to be loaded is then executed (“run”). The creation of processes and threads is usually closely monitored and regulated by EDR software, which is why fork and run has not been a viable solution in well-secured environments for some time now. .NET executables also run through the Antimalware Scan Interface (AMSI), and removing it is often detected. EDR software is developing rapidly in this area.

This is exactly where BOFs come into play. They are designed in such a way that they are not dependent on the fork-and-run pattern but instead can be executed completely within the beacon process. Of course, this also has the advantage that they do not have to be stored on the hard disk at any time. Since BOFs are developed in C, they theoretically are unlimited in their range of functions.

Due to the relatively high popularity of BOFs (at least within the Cobalt Strike environment), there are already many implementations of known attacks that we also want to make use of. We will see some of them in the second part of this blog series.

While Cobalt Strike, as the pioneer project using BOFs, has a whole ecosystem built around them, Mythic lacks native BOF support. Porting them to other frameworks has been done several times: Havoc, Sliver, Empire and Brute Ratel are other C2 frameworks that also support BOF execution. However, many of these solutions lack compatibility with BOFs that were explicitly built for Cobalt Strike. This is often because many BOFs are instrumented by Cobalt Strike’s Aggressor Script – a proprietary scripting language that manages the invocation of BOFs on the server side amongst many other things. Aggressor Script is based on Sleep, an interpreter language for the Java Virtual Machine (JVM), which is why it cannot be used for Mythic (or any other C2 framework not written in Java).

Likewise, the implemented loaders are technically dependent on the C2 infrastructure in some cases, making it difficult to port them to Mythic. Our goal was to avoid these issues with our own approach and thereby make BOFs usable for us as well. The third part of this blog series covers the development of our BOF loader in detail as well as how we bypassed the dependency on Aggressor Script. But first, we will look at the BOFs’ file format to see how they work.

How do BOFs work?

Forta’s official documentation on developing BOFs is our first point of reference for explaining how they work. It shows the minimum code boilerplate for a BOF and compiler calls for it.

#include <windows.h>
#include "beacon.h"

void go(char *args, int alen) {
    BeaconOutput(CALLBACK_OUTPUT, "Hello, World! ", 13);
}

We will go into detail about the sample code later. Let’s just assume that this is working BOF code that outputs “Hello, World!”.

Since BOFs are designed to run on Windows, they should be compiled with a Windows-native compiler or the cross-compiler toolchain MinGW if you want to build on Linux. These sample calls are listed in the documentation:

  • cl.exe /c /GS- hello.c /Fo hello.x64.o
    for compilation on Windows
  • x86_64-w64-mingw32-gcc -c hello.c -o hello.x64.o
    for compilation on Linux using MinGW

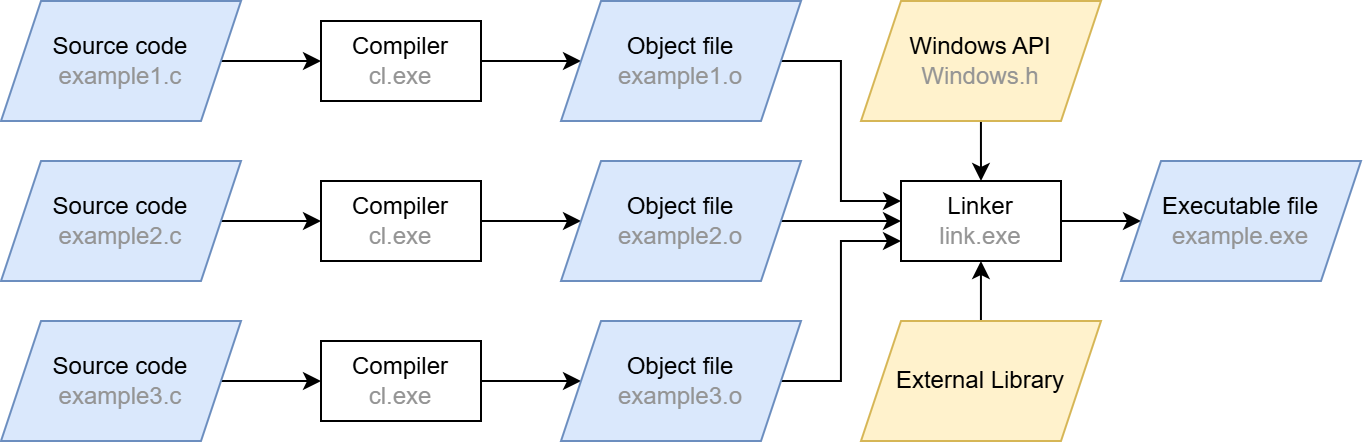
These calls will compile the source code input file hello.c, which includes our boilerplate BOF code. You may have noticed the /c and -c switches. Apart from those flags, these are just standard compiler calls (the /GS- flag for cl.exe simply disables the stack overflow protection). The /c and -c switches stand for “compile only”, which may sound redundant at first – after all, we are working with a compiler. However, a usual compiler call does more than that: after compilation, the linker is automatically invoked. The compilation step merely converts the source code into machine code. The linker then ensures that external functions are resolved (“linked”) and that the machine code is converted into the executable Portable Executable (PE) format.

When the linking step is left out, the compiler produces a so-called object file (ending in .o or .obj) from the source code instead of a runnable program. Although this file contains the translated machine code, it does not yet contain a complete execution environment. In particular, there are no references to external libraries and functions: their pointers are not yet filled with actual addresses, which is one of the tasks the linker would do. Skipping the linker also has the effect that there can always be exactly one object file per translation unit, which is just the fancy term for a single C/C++ source code file after precompilation. Linking several object files together is also a task of the linker. It also provides the entry point for the executable so that the operating system knows where to begin running it.

A simplified compilation process is shown below. In our case, we stop after the compilation step and are thus left with the .o files.

Figure 2: Simplified illustration of a full compilation process on Windows

When targeting Linux, these object files are saved in the Executable and Linking Format (ELF) just like fully linked, executable files. On Windows, a separate format is used called Common Object File Format (COFF). Since BOFs are targeting Windows, COFFs are the ones generated by these compilation instructions provided by the Cobalt Strike documentation.

Let’s take a look at how this format is structured.

Understanding the COFF file format

The COFF format originated in the Unix ecosystem, where it was already used for object files. Linux nowadays uses the ELF format, but COFF has been adopted by Windows. It is structurally very similar to the executable PE format and serves as its basis. Therefore, many of the COFF elements are part of the PE specification.

Thus, COFF is an intermediate unit right before PE where the linker has not yet engaged. As a result, COFF files must hold metadata for the linker, as it is intended that the linker will later process them into an executable. Due to this metadata, the COFF format is more verbose and contains more debugging information but still remains smaller than a PE file, as most external implementations and operating system specifics to run it are not yet included. This usually results in file size savings between 65 and 90 percent compared to a linked PE file, mostly depending on the proportion of external symbols.

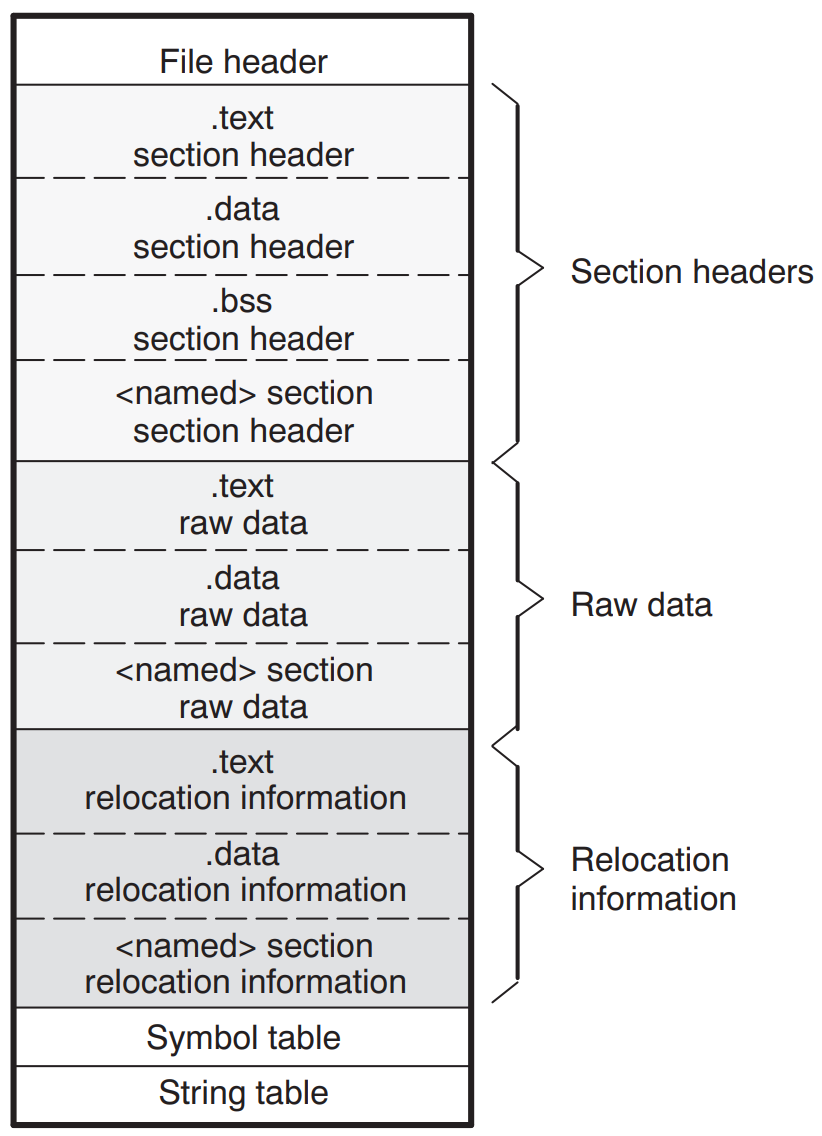
A COFF file consists of several parts, each serving a specific purpose:

File header

The file header contains general information about the file. Most importantly, this includes the number of sections as well as pointers to and sizes of the other parts of the COFF file, like the symbol table, which we will cover shortly. These pointers allow us to maneuver around every bit of the file using basic math.

Sections

The actual contents of COFF files are stored in named sections. Each section has a well-defined purpose as seen in other file formats, too: The most important section is the .text section, containing the executable machine code. There are also the .data, .bss and .rdata sections, holding static global, uninitialized and read-only variables, respectively.

Each section has a section header, all of which follow immediately after the file header in the COFF file. The section headers contain metadata about the section’s raw data, such as its position and size, similar to the information in the file header. However, the most important information here is the “Pointer to Relocations” field. It marks the memory position to the relocation information section where unresolved symbols are listed. Symbols are used to abstractly denote variables, functions, but also cross-referencing data such as string constants. Since the linker has not yet been applied to the file, these symbols have not been set correctly. In a normal scenario, they are only resolved once the final memory layout is known.

Symbol table

The symbol table provides metadata for symbols used in the file. For example, if the function int add(int a, int b) is defined in this file, it is represented as the symbol add in this table. The table itself can have any number of entries and therefore has an indefinite size. However, the entries themselves are always 18 bytes in size. The most important fields in such an entry are:

  • Name of the symbol (or pointer to the name)
  • Address of the symbol (where it is defined in the program)
  • Section number (1-based, 0 if the symbol is not defined within this COFF file)

Symbols are of two types: internal and external. Internal symbols reference a symbol created within the COFF. The section number field then contains the corresponding section in which the symbol is defined. If the symbol is external (e.g. pulled in from an external library), the section number field is set to 0. This is the sign for the linker to go and find the correct implementation of that symbol somewhere else.

Also, pay attention to the symbol name field: it is implemented as a union that can take two data types at the same time. The first possible value is a char[8] and is defined to contain the name of the symbol. It can therefore only be 8 bytes long (must not be null terminated. If the symbol name happens to be longer, it is stored in the string table instead. To recognize this, the first byte of the union is set to zero. The rest of the union contains a memory offset relative to the beginning of the string table, defined as uint32_t[2]. The symbol can be retrieved at this position. External symbol names also follow a convention in which they are prefixed with a constant that is specific to the platform ‑ if marked as such by using the DECLSPEC_IMPORT attribute. These prefixes are:

  • __imp_ for the x64 platform
  • __imp__ for the x86 platform

The external printf function, for example, would then have the symbol name __imp_printf on the x64 platform. This is important, as it makes it possible to identify an external symbol by its name prefix only. On Linux, the symbols of a COFF file can be listed manually using the nm tool: nm -C <coff_file>:

Figure 3: Sections and symbols of the tgtdelegation.x64.o BOF

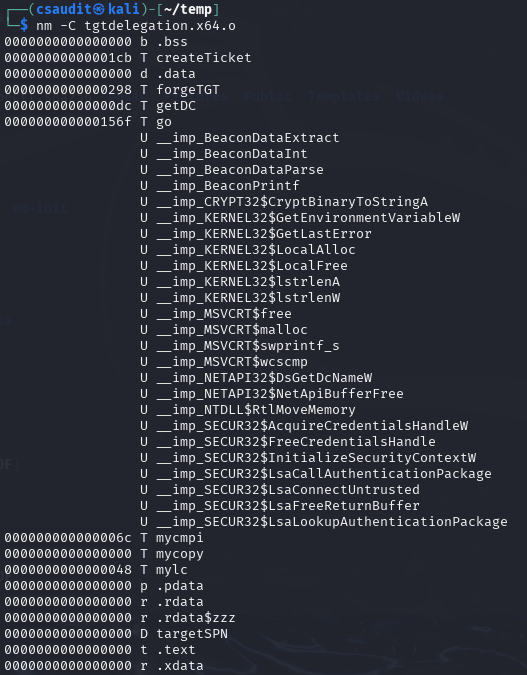
Here we can see some external functions starting with Beacon and some other strange looking functions containing a dollar sign. We will take a look at them in a bit.

Symbols are usually not accessed through the symbol table itself (e.g. by iterating over the table). They are referenced in the relocation information entries, which we will cover next.

Relocation information

A relocation in the context of object files refers to an adjustment applied to machine code or other data to correct memory addresses that cannot be determined at compile time. Specifically, relocations mark locations within a section where symbol addresses must be inserted once the final memory layout is known during linking (or in this case during manual loading). Relocation entries are very small in size, as they only contain these three fields:

  • Virtual address: the address of the item to which relocation is applied (offset from the beginning of the section, plus the values of the sections RVA/Offset field)
  • Symbol index: index in the symbol table for the relocation target
  • Type: specifies the relocation type

Since we need to mimic a linker, these relocation entries are important to us. Luckily, doing those relocations is straightforward. The virtual address field contains the relative address where a symbol is accessed within the section (e.g. a function call). We simply extract the name and address of the symbol pointed to by the symbol index field within the symbol table and search for the symbol (e.g. the function definition). Then, we place the actual virtual address of this symbol’s location to the address pointed to by the virtual address field.

This approach, however, has two tricky obstacles. First, this “search for the symbol” procedure is not predefined, especially not for external symbols. For this, we need a separate mechanism, which we will explain later. Second, the virtual address of the symbol found cannot simply be copied to the relocation location. We must observe a few guidelines. These guidelines are specified by the Type field. Some relocations must be address offsets relative to the start of the section, others must be absolute addresses. The sizes of the addresses can also differ, even within the same processor architecture. The different types are described in the PE specification, which is why we will not go into detail here (it’s kind of boring anyways).

String table

As already described, this section holds the symbol names from the symbol table that are larger than 8 bytes. The table begins with an integer that specifies its size, following the null-terminated name strings. The index referenced in the symbol table entry can be read up to the null terminator to retrieve the full name from this table.

Summary

This is a general representation of a COFF file with the .text and .data sample sections and the individual areas:

Figure 4: Basic structure of a COFF file

With this information, we are now able to reproduce the linking process. In summary, this is what we need to do:

  1. Jump from the file header to the first section header
  2. From there, iterate over all section headers using the number of sections field
  3. For each section header, iterate over all relocation entries for this section
  4. For each symbol entry, check if its name is stored directly within it or retrieve it from the string table otherwise
  5. Check if the symbol is an external symbol
    1. If yes: search for the external symbol and resolve it manually
    2. If no: resolve the symbol manually

Now we know the most important aspects of how COFF files work. As hopefully apparent by now, our goal is to replicate the linking process from Windows’ own linker but not “ahead of execution” but rather dynamically at runtime. We will do this by copying the BOF into memory and do the relocations for it manually. Furthermore, in-memory linking is advantageous because otherwise, linking would have to take place on the file system, which could be quickly classified as suspicious by EDR software.

But there is still one thing missing from our approach so far that a standard executable EXE has. As mentioned above, we do not yet have a relocation mechanism that allows us to search for external symbols. Specifically, this means that we can only use functions that we have implemented ourselves (internal symbols). This is a huge limitation because it means that both the C standard library (malloc, free, memcpy, strcmp, etc.) and even more powerful functions such as those from the Windows API (VirtualAlloc, VirtualFree, LoadLibrary, etc.) are not available to the BOF. We can only fall back on the functionality that the compiler provides natively (so-called compiler intrinsics).

Fortunately, Cobalt Strike invented some workarounds, which are even frequently used by several BOFs. We also need to support these so that we can execute BOFs designed specifically for Cobalt Strike, which is part of our goal.

The holy quadruplicity of manual function resolution

It would be unreasonable to expect our custom linker to be familiar with every conceivable Windows function. Fortra probably thought the same thing when they decided to link only four functions to the BOF by default, namely LoadLibraryA, GetModuleHandleA, GetProcAddress and FreeLibrary. With these functions, almost the entire range of the Windows API is available with relatively little implementation effort because they can be used to resolve virtually anything at runtime. So, we are already in a relatively good position with these four functions.

Our linker must know these four functions by name and be able to link them to the BOF as soon as they are called.

Interacting with the C2 infrastructure through the Beacon APIs

One of the workarounds for providing the beacon with more functions are the so-called Beacon APIs. They are made available to the beacon developer as a C header, usually referred to as beacon.h. After including it, the contained functions can be called in the BOF like usual C/C++ functions, for example to send output to the C2 server, to persist data in the beacon’s memory or to use predefined functions for process injection.

Since these functions are to be implemented in the beacon, they are external functions from the BOF’s point of view. When a BOF calls one of these functions, the calls there are visible as external symbols and must be linked before execution. That is the job of our BOF loader: it must know the functions (more precisely, their addresses) and link them into the BOF using COFF relocations.

The Beacon API functions in beacon.h can be grouped by functionality as follows:

Beacon APIDescription
Data Parser APIReads the parameters passed to the BOF at invocation
Format APIUtility functions to help with formatting strings
Output APISends output to the C2 controller
Token APIManipulation of the beacon’s current thread token
Spawn+Inject APILeverages some of the beacon’s process injection capabilities
Utility APIA single utility function for string encoding conversion
Key/Value Store APIGives access to a minimal key/value store within the beacon’s memory
Data Store APIData store with the ability to obfuscate the stored data at runtime
User Data APIRetrieves the Beacon User Data (BUD) buffer when using a User-Defined Reflective Loader (UDRL)
Syscall APIMacros that call several Syscall functions resolved by the beacon
Beacon Gate APIEnables/Disables Cobalt Strike’s BeaconGate feature

Most of these groups merely contain helper functions. The others correspond to a feature of Cobalt Strike. The most important ones are the Data Parser, Format and Output API. They are the minimum requirement for operating BOFs so that they can be parameterized and communicate with the C2 controller. All other APIs are only used sporadically by most BOFs, which we will go into detail in part two of this blog post series. That is why we will only discuss the first three here.

Data Parser API

The Data Parser API is used to extract arguments given to the BOF at invocation. They are serialized (packed) into a size-prefixed binary blob by Cobalt Strike. The Data Parser API unwraps this blob into its original arguments again. The parameters can then be retrieved like this:

#include "beacon.h"
void go(char *args, int alen) {
    datap parser; // define the parser struct (defined in beacon.h)
    char *arg1;     // define arg1
    short arg2;     // define arg1
    BeaconDataParse(&parser, args, alen);       // initialize the parser struct (mandatory)
    arg1 = BeaconDataExtract(&parser, NULL); // get first arg (string)
    arg2 = BeaconDataShort(&parser)               // get second arg (short)
}

Depending on the type of data to be extracted, different functions must be used. For strings or raw data, it is BeaconDataExtract; for shorts, it is BeaconDataShort; for ints, it is BeaconDataInt, etc. They must be called in the same order as the parameters were given to the BOF.

A BOF implementation would therefore have to be able to generate precisely this size-prefixed binary blob format and pass it on to the loader to be compatible with BOFs written for Cobalt Strike. TrustedSec provides a small Python script with its own BOF loader for this purpose.

Format API

The Format API is used to build large or repeating strings. It helps with allocating memory for strings and simplifies formatting, as this is not trivial within BOFs. Syntactically, it works like the printf function from the standard library. As in the Data Parser API, there is a dedicated struct definition formatp, which is used to manage memory and to keep the state of the current allocation.

An example on how the Format API is used manually can be seen here; however, the Format API is usually invoked as part of the Output API.

Output API

The Output API returns output to the C2 controller (i.e. Cobalt Strike) through the C2 profile. This is probably the most important API because it is the only way to see any results from BOFs. It allows displaying messages as informational and as errors using the type parameters of the functions.

The Output API offers two functions: BeaconOutput to print constant strings and BeaconPrintf to print formattable strings. The latter one is usually implemented using the Format API functions itself since printf logic is already present there.

In Figure 2, we have already used BeaconOutput to print “Hello, World!”. This string is transmitted through the C2 profile to the controller.

As shown in the table above, there are several other Beacon API groups. However, many of them are simply unsuitable for use outside of Cobalt Strike, as they interact with functions that only exist or make sense within it. We have therefore focused only on the ones mentioned above.

However, there is yet another powerful way to extend the functionality of BOFs: Dynamic Function Resolution.

Extending functionality using Dynamic Function Resolution

Although we can already reload any functions manually by using LoadLibraryA and GetProcAddress, this is not particularly convenient. BOFs offer a simpler alternative: Dynamic Function Resolution (DFR). DFR is a convention for naming external functions within the BOF code so that the loader can recognize them prior to execution, which is much less error prone. These so-called DFR declarations allow the use of external Windows API functions as long as they can be found by the loader.

A DFR declaration consists of the name of the library, a $ and the name of the function. In addition, the “WINAPI” attribute must be specified, and the return type and parameters must be set correctly. For example, the DFR declarations for VirtualAlloc and DsGetDcNameA must look like this:

// VirtualAlloc from KERNEL32
void *WINAPI KERNEL32$VirtualAlloc(LPVOID, SIZE_T, DWORD, DWORD);
// DsGetDcNameA from NETAPI32
DWORD WINAPI NETAPI32$DsGetDcNameA(LPVOID, LPVOID, LPVOID, LPVOID, ULONG, LPVOID);

The loader then sees the function name and recognizes it as an external symbol. Then, all it must do is load the part before the $ with LoadLibrary and the part after it with GetProcAddress, and you have the function address. Of course, there are other, quieter methods available, such as PEB walking, but for the sake of simplicity, we will stick to the “official” method for now. The function pointers can then be linked to the function call locations using COFF relocation.

TrustedSec has also taken the trouble to collect all useful functions of the Windows API and provide them as DFR declarations in a C header file called bofdefs.h. It can be obtained here. After including it, you can directly use most of the Windows API functions by their DFR signature.

Conclusion

In this first part of the BOF blog post series, we showed how BOFs and the underlying COFF file format are structured, how to build your own mini-linker and how BOF functions can be extended using the Beacon API and DFR.

In the next part, we will look at a few publicly available BOFs to see how powerful BOFs can be in practice. The third and final part goes into more technical detail and deals with the implementation of the loader/linker.

Further blog articles

Do you want to protect your systems? Feel free to get in touch with us.

Windows Instrumen­tation Callbacks – Part 2

Search

Windows Instrumen­tation Callbacks – Part 2

November 12, 2025

Windows Instrumentation Callbacks – Hooks, Part 2

Introduction

This multi-part blog series will be discussing an undocumented feature of Windows: instrumentation callbacks (ICs).

If you have not yet read the first part of this series, we strongly recommend you read it to find out what ICs are and how to set them.

In this blog post you will learn how to do patchless hooking using ICs without registering or executing any user mode exception handlers.

Disclaimer

  • This series is aimed towards readers familiar with x86_64 assembly, computer concepts such as the stack and Windows internals. Not every term will be explained in this series.
  • This series is aimed at x64 programs on the Windows versions 10 and 11. Neither older windows versions nor WoW64 processes will be discussed.

Recap

In the first blog post we learned how to install an IC on a process and how to use that callback to interact with specific syscalls. We learned this by intercepting the syscall made by OpenProcess inside the subfunction NtOpenProcess. After intercepting NtOpenProcess, we close the handle that was opened and spoof a return value of STATUS_ACCESS_DENIED. This allows us to get a callback on every syscall that returns and which was made. However, it does not allow hooking arbitrary code. Also consider this: a program calls NtSetInformationProcess to set its own IC after you have already set an IC. Which IC do you think is called? Your original IC or the new IC passed in NtSetInformationProcess? Give it a try.

Hooking

If you are reading this article, there’s a good chance you know what patchless hooking is. If you don’t, we will explain the patchless part; however, you are assumed to know what hooking in general refers to.

There are many hooking techniques, but they are either patchless or require a patch. Regular inline hooks work by patching the executable memory/the binary to redirect execution to the code of the installed hook. Assuming a person wants to hook a binary file on disk, and changes (aka patches) the binary’s bytes, the signature of the binary is changed, as the binary no longer contains the same bytes.

Patchless hooking

As you might’ve guessed, patchless hooking techniques are techniques that do not require a patch. This means, none of the bytes in the executable memory region that is to be hooked are changed, so the signature of that memory region stays the same, meaning the hook can’t be detected by signature scans.

The most common patchless hooking techniques in Windows user mode are probably vectored exception handler (VEH) hooking and page guard hooking. Both these techniques utilize a core concept of Windows and operating systems in general: exceptions.

Page guard hooking works by setting the PAGE_GUARD memory page protection modifier on a certain memory page. Once that memory page is accessed, the system raises an exception that can be handled by an exception handler.

VEH hooking also requires setting up an exception handler, but instead of page guards, hardware breakpoints are used to trigger the exceptions.

Assuming you, for example, add a __debugbreak() to your C/C++ code that adds a software breakpoint, hardware breakpoints are generated by the CPU.

Hardware breakpoints can be set with specific registers in x86_64 CPUs:

  • Dr0-3: These four registers contain the addresses of where the breakpoint should be set.
  • Dr6: This is the status register that contains information about which breakpoint fired during exception handling.
  • Dr7: This is the control register that, using bit flags, controls which debug registers are active and what type of breakpoint is used: read/write/execute.

Exceptions and vectored exception handling

In short, VEHs allow developers to register their own exception handler. For this, Microsoft provides the function AddVectoredExceptionHandler. Let’s look at the function definition:

PVOID AddVectoredExceptionHandler(
ULONG                       First,
PVECTORED_EXCEPTION_HANDLER Handler
);

The function takes a pointer to an exception handler function and an ULONG parameter. Internally, Windows stores the pointers to all the exception handlers in a linked list. If the ULONG parameter, i.e. the parameter called First, is not zero, the exception handler will be added to the start of the linked list instead of the end.

The Handler parameter takes a function pointer to the exception handler that should be added. The function should look as follows according to MSDN:

LONG PvectoredExceptionHandler(
[in] _EXCEPTION_POINTERS *ExceptionInfo
)

The function should take a pointer to an EXCEPTION_POINTERS structure as that will hold the information about the exception which occurred. Most importantly, it will hold a CONTEXT structure of when the exception occurred. The CONTEXT structure holds processor-specific register data such as the member Rip containing the value the CPU register rip had when the exception occurred.

According to documentation, the exception handler should either return EXCEPTION_CONTINUE_EXECUTION (-1) or EXCEPTION_CONTINUE_SEARCH (0). This is used by Windows to decide whether the exception was handled or if the executed exception handler could not/did not want to handle the exception.

The process goes as follows: when an exception is thrown, a context switch to kernel mode occurs, which will then fill out an EXCEPTION_POINTERS structure based on the thrown exception. The kernel then returns to user mode and executes one VEH after another until one of them responds with EXCEPTION_CONTINUE_EXECUTION. If no VEHs to execute are left and the exception wasn’t handled, the process terminates.

The exception handling works based on a first-come, first-served principle: if a VEH in the linked list responds with EXCEPTION_CONTINUE_EXECUTION, the VEHs contained in the linked list after the executed VEH will no longer be executed.

There are ways to avoid calling AddVectoredExceptionHandler to register a VEH, for example by manually locating and manipulating said linked list. However, the same problems and IoCs remain:

  • Our own VEH needs to be part of the linked list.
  • All VEHs before our own VEH in the linked list are executed and can handle the exception first.

Wouldn’t it be nice if we could handle exceptions without adding our exception handler to the linked list while also guaranteeing that our exception handler is executed before any other exception handlers? Or without even calling the other exception handlers at all?

If you were a careful reader of the first part of the series, you might’ve already concluded where this is going: if an exception is a user-mode-to-kernel context switch, which then returns to user mode, can we intercept the return to user mode with our IC?

How convenient that we also created a PoC to log syscall names in the first part. Why don’t we just try using that PoC to see if something shows up when an exception is thrown?

KiUserExceptionDispatch

When an exception is thrown, the KiUserExceptionDispatch function from ntdll is called. As the kernel returns here, we’re guessing that this function most likely calls the registered exception handlers somewhere down the road. Let’s check this theory by opening ntdll! KiUserExceptionDispatch in a decompiler. Luckily, figuring out what the function does is simple because of function names provided by Microsoft:

+0x00    void KiUserExceptionDispatch() __noreturn
+0x00    {
+0x00        int64_t Wow64PrepareForException_1 = Wow64PrepareForException;
+0x0b        void arg_4f0;
+0x0b      
+0x0b        if (Wow64PrepareForException_1)
+0x1a            Wow64PrepareForException_1(&arg_4f0, &__return_addr);
+0x1a      
+0x29        char rax;
+0x29        int64_t r8;
+0x29        rax = RtlDispatchException(&arg_4f0, &__return_addr);
+0x30        int32_t rax_1;
+0x30      
+0x30        if (!rax)
+0x30        {
+0x4b            r8 = 0;
+0x4e            rax_1 = NtRaiseException();
+0x30        }
+0x30        else
+0x37            rax_1 = RtlGuardRestoreContext(&__return_addr, nullptr);
+0x37      
+0x55        RtlRaiseStatus(rax_1);
+0x55        /* no return */
+0x00    }

We can ignore the Wow64 functions because we are only focussing on ICs in non-Wow64 processes as mentioned in the disclaimer.

The code after the Wow64 functions looks interesting; RtlDispatchException is called with two parameters. The parameter names were auto-generated by BinaryNinja.

If we look at the disassembly of the function, we can see that both parameters used for calling RtlDispatchException are taken from the stack. This is also why the second parameter was named as __return_addr by BinaryNinja, as the address is on top of the stack, which is normally the return address. Further down the decompiled snippet, we see a call to RtlGuardRestoreContext. This function does not have documentation on MSDN; however, RtlRestoreContext does. If we peek into RtlGuardRestoreContext with a disassembler/decompiler, we can see it’s just a wrapper around RtlRestoreContext with some sanity checks. Looking at the documentation, we can see that RtlRestoreContext takes a pointer to a CONTEXT structure and an optional second pointer to a _EXCEPTION_RECORD struct. So, the parameter named __return_addr by BinaryNinja is a pointer to the CONTEXT structure of the exception. Theoretically, this would already suffice to do some basic hooks, but let’s get access to the other member of the EXCEPTION_POINTERS structure: EXCEPTION_RECORD. If __return_addr is the CONTEXT structure, the first argument is the EXCEPTION_RECORD structure, as that is also retrieved from the stack that was set up by the kernel for the user mode exception handling. Let’s not overcomplicate things with further static analysis; instead, we can write a program that uses VEH and attach a debugger to it. For this, I’ll use the following program that registers a VEH and then performs a null pointer dereference to cause an exception:

#include "Windows.h"
long exception_handler(EXCEPTION_POINTERS* exception_info) {
   return EXCEPTION_CONTINUE_SEARCH;
}
int main()
{
   AddVectoredExceptionHandler(1, &exception_handler);
   bool* test = nullptr;
   *test = true;
   return 0;
}

Following the compilation, the program was opened in the debugger WinDbg.

First, breakpoints on both the exception handler and the call to RtlDispatchException inside the function KiUserExceptionDispatch were set, as RtlDispatchException takes the pointer to the CONTEXT structure and another parameter, which might be a pointer to the EXCEPTION_RECORD structure.

0:000> bp ntdll!KiUserExceptionDispatch+0x29
0:000> bp exception_handler

After resuming execution, the breakpoint in KiUserExceptionDispatch is executed first as expected. After the breakpoint is triggered, we read out rcx and rdx, because according to the Windows x64 calling convention, these registers will hold the first and second function parameter.

Breakpoint 0 hit
ntdll!KiUserExceptionDispatch+0x29:
00007ffe`2f571439 e8d20efbff      call    ntdll!RtlDispatchException (00007ffe`2f522310)
0:000> r rcx
rcx=0000003d38affa30
0:000> r rdx
rdx=0000003d38aff540

Now, we need to cross-reference these values with the values of the EXCEPTION_POINTERS structure that is passed to the exception handler. This can easily be done with a handy feature of WinDbg: the display type command (dt).

0:000> g
Breakpoint 1 hit
veh_hooking_test!exception_handler:
00007ff7`30c41000 50              push    rax
0:000> dt EXCEPTION_POINTERS @rcx
veh_hooking_test!EXCEPTION_POINTERS
  +0x000 ExceptionRecord  : 0x0000003d`38affa30 _EXCEPTION_RECORD
+0x008 ContextRecord    : 0x0000003d`38aff540 _CONTEXT

As you can see, our assumption was correct: the parameters passed to RtlDispatchException are the EXCEPTION_RECORD and CONTEXT structure. As you can also see, KiUserExceptionDispatch calls RtlGuardRestoreContext on the CONTEXT structure after RtlDispatchException was executed.

RtlRestoreContext, the function internally called by RtlGuardRestoreContext, sets the registers of the specified thread as specified in the CONTEXT struct passed to that function. This means, rip, the instruction pointer, is also overwritten so code after the call to RtlRestoreContext is never executed. This also means that the C++ function (named instrumentation_callback in the previous blog post) won’t return to your assembly bridge to execute everything after the C++ function call.  The IC flag will thus never be reset.

IC exception handling

We now know how we can get access to the EXCEPTION_RECORD and CONTEXT structures and know how KiUserExceptionDispatch resumes execution – with RtlGuardRestoreContext.

All we now need to do is get our IC to intercept KiUserExceptionDispatch, retrieve the EXCEPTION_RECORD and CONTEXT off the stack and resume execution if we want to handle the exception.

We will reuse the same assembly bridge as in the first part of this blog series.

For now, let’s not add hooking but instead create a regular exception handler that continues execution after an access violation. For this, a modified version of the code snippet previously used for debugging will be used. The following snippet adds a regular exception handler that returns EXCEPTION_CONTINUE_EXECUTION, which means that the exception was handled, and that the execution of the program can continue:

#include "Windows.h"
#include "print"
long exception_handler(EXCEPTION_POINTERS* exception_info) {
   exception_info->ContextRecord->Rip += 3;
   return EXCEPTION_CONTINUE_EXECUTION;
}
int main()
{
   AddVectoredExceptionHandler(1, &exception_handler);
   bool* test = nullptr;
   *test = true;
   std::println("Access violation skipped");
   return 0;
}

You might wonder why we are adding a hardcoded value of 3 to the value of rip that is saved in the CONTEXT record. This is used to skip the access violation at the line *test = true, as it gets compiled to the bytes c60001, so 3 bytes that need to get skipped to prevent the exception from being triggered again once execution continues.

In non-test code you would not want to do this, as a different compiler or the same compiler with different settings could also produce other instructions to perform the same logic. Normally, you would want to use a disassembler such as Zydis to disassemble the instruction rip points to, to dynamically calculate the length of the instruction. We decided against this to keep the snippet code as minimal as possible.

Let’s now remove the AddVectoredExceptionHandler line and try to replace it with an IC.

First, register an IC using the same logic/code as in the first part of this series. In this part, we will only cover changes to the instrumentation_callback function, as the rest remains the same as in the first blog post.

The following IC can be used to execute the same exception handler that would’ve been called if you added it with AddVectoredExceptionHandler. The code for the function is simple; if you’ve understood the blog posts so far you shouldn’t have a problem understanding it. The only part that was not covered was the offset of 0x4f0 from rsp to get the EXCEPTION_RECORD*. This comes from KiUserExceptionDispatch. We only showed the decompiled version of the code, which of course does not contain the stack offsets. If you disassembled that function and looked at the function call to RtlDispatchException, you would see the 0x4f0 offset.

You might also notice that we are using KiUserExceptionDispatcher instead of KiUserExceptionDispatch with GetProcAddress. That is because the function is exported as KiUserExceptionDispatcher.

extern "C" uint64_t instrumentation_callback(uint64_t original_rsp, uint64_t return_addr, uint64_t return_val) {
static uint64_t user_exception_addr = 0;
if (!user_exception_addr) {
   user_exception_addr = reinterpret_cast<uint64_t>(GetProcAddress(GetModuleHandle("ntdll.dll"), "KiUserExceptionDispatcher"));
}
if (return_addr != user_exception_addr)
   return return_val;
EXCEPTION_POINTERS exception_pointers = {};
exception_pointers.ContextRecord = reinterpret_cast<CONTEXT*>(original_rsp);
exception_pointers.ExceptionRecord = reinterpret_cast<EXCEPTION_RECORD*>(original_rsp + 0x4f0);
auto exception_status = exception_handler(&exception_pointers);
if (exception_status == EXCEPTION_CONTINUE_SEARCH)
   return return_val;
RtlRestoreContext(exception_pointers.ContextRecord, nullptr);
// This will never be reached if RtlRestoreContext executes successfully
return return_val;
}

With this code, the Windows exception handlers are never executed if our own exception handler returns EXCEPTION_CONTINUE_EXECUTION, as the code restores the context before the regular exception handlers are even called.

Hooking with ICs

Skipping access violations is cool, but it’s not useful compared to what else we can do with an exception handler. So, let’s return to the main topic of this blog post: how to hook code with ICs. For this, we will create an imaginary scenario: we have an installed IC and want to hinder someone else from overwriting/removing our IC. This will only work within the same process context because ICs are process-local – a different process can overwrite the IC remotely if it has the necessary privilege (SeDebugPrivilege).

We’ve touched on hardware breakpoints and debug registers before, but we haven’t set any. We mentioned that hardware breakpoints are set via CPU registers – the debug registers. This means, they are thread-specific: they will only trigger from the specific thread for which they were set. To set the breakpoints for the entire process, the hardware breakpoints need to be set for all threads, and you also need to be careful of thread creations.

Setting hardware breakpoints

To use hardware breakpoints, we first need to set the debug registers accordingly.

For this purpose, we created a function with the following function definition:

bool set_hwbp(debug_register_t reg, void* hook_addr, bp_type_t type, uint8_t len)

The definitions for the two custom enums debug_register_t and bp_type_t look as follows:

enum class debug_register_t {
Dr0 = 0,
Dr1,
Dr2,
Dr3
};
enum class bp_type_t {
Execute = 0b00,
Write = 0b01,
ReadWrite = 0b11
};

These are not mandatory; however, we use them to make our intentions clearer instead of directly requiring numbers or bit literals to be passed. As mentioned before, there are four debug registers that can contain the address of a breakpoint. Each of these debug registers has separate options that can be set. This allows execution, read, and read and write breakpoints.

Now Dr7, the control register, needs to be set accordingly.

OSDev wiki has a table explaining the structure of Dr7:

Figure 1: https://wiki.osdev.org/CPU_Registers_x86#Debug_Registers

Consultant

Category
Date
Navigation

For each hardware breakpoint we want to set, we need to do three things:

  1. Set Dr0/1/2/3 to the address.
  2. Enable the corresponding local breakpoint for the passed debug_register_t (bits 0–7)
  3. Set the correct condition based on the passed
  4. Set the correct size for the breakpoint. For execute breakpoints, it always needs to be 0.

Steps 1 and 2 can be done using the following code:

bool set_hwbp(debug_register_t reg, void* hook_addr, bp_type_t type, uint8_t len) {
CONTEXT context = { .ContextFlags = CONTEXT_DEBUG_REGISTERS };
if (!GetThreadContext(GetCurrentThread(), &context))
   return false;
if (reg == debug_register_t::Dr0)
   context.Dr0 = reinterpret_cast<DWORD64>(hook_addr);
else if (reg == debug_register_t::Dr1)
   context.Dr1 = reinterpret_cast<DWORD64>(hook_addr);
else if (reg == debug_register_t::Dr2)
   context.Dr2 = reinterpret_cast<DWORD64>(hook_addr);
else
context.Dr3 = reinterpret_cast<DWORD64>(hook_addr);

As the debug registers can’t be directly modified from user mode, we need to use the corresponding Windows APIs (GetThreadContext and SetThreadContext). We then set Dr0/1/2/3 to the hook address.

The steps afterwards become a bit more complicated due to bitwise operations being needed. Additionally, the corresponding bit positions need to be calculated in Dr7.

For brevity’s sake, we added comments to the specific passages instead of explaining it via text:

[…]
// Converts enum type to its underlying type to use it for calculations
auto reg_index = std::to_underlying(reg);
// Enables local breakpoint (bit position 0/2/4/6)
context.Dr7 |= 1ULL << (reg_index * 2);
// Clear and set condition (execute/write/read and write)
context.Dr7 &= ~(0b11ULL << (16 + reg_index * 4));
context.Dr7 |= (std::to_underlying(type) << (16 + reg_index * 4));
// Execution breakpoints always require the length to be 0
if (type == bp_type_t::Execute)
   len = 0;
// Clear and set length
context.Dr7 &= ~(0b11ULL << (18 + reg_index * 4));
context.Dr7 |= (len << (18 + reg_index * 4));
return SetThreadContext(GetCurrentThread(), &context);
}

Now we’ve got everything set up to install a hardware breakpoint. The following snippet can be added to your main function to install a breakpoint on function calls to NtSetInformationProcess:

set_hwbp(debug_register_t::Dr0, nt_set_info_proc, bp_type_t::Execute, 0);

This should crash your program if you call the specified function and have no exception handler that handles the exception.

Modifying the exception handler

Now we only need to make the exception handler handle the exception caused by the hardware breakpoint. For this, we don’t need to touch the IC as it already correctly calls the exception handler; instead, we need to modify the function exception_handler.

First, we need to detect if the exception was caused by one of the debug registers. This can be easily done by checking the rip register for breakpoints caused by execution; however, we also want compatibility with write and read/write breakpoints. These types of breakpoints will contain the address of the operation that tries to access the address within a debug register in rip. Instead of checking rip, we can use Dr6: the debug status register. When a debug register is fired, the bits 0-3 will be set according to which debug register is set. For example, when Dr2 is fired, bit 2 will be set.

The debug registers are luckily included in the ContextRecord member of the EXCEPTION_POINTERS structure passed to VEH handlers. This means, we don’t need to call GetThreadContext again to retrieve it.

Here is an example of how to check which debug register fired:

long exception_handler(EXCEPTION_POINTERS* exception_info) {
if (exception_info->ContextRecord->Dr6 & 1)
   std::println("Dr0 fired");
else if (exception_info->ContextRecord->Dr6 & 2)
   std::println("Dr1 fired");
else if (exception_info->ContextRecord->Dr6 & 4)
   std::println("Dr2 fired");
else if (exception_info->ContextRecord->Dr6 & 8)
   std::println("Dr3 fired");
[…]

Before implementing the actual logic that hinders someone from overwriting an IC, we need to fix the error you’ve most likely ran into if you tried testing that code: the exception keeps firing till the program eventually crashes.

The solution for this is the resume flag; this is a bit in the RFLAGS register. The explanation for this bit can be found in the AMD manual: “[…] The RF bit, when set to 1, temporarily disables instruction breakpoint reporting to prevent repeated debug exceptions (#DB) from occurring. […]”. So, all we need to do is set the resume flag, which is at bit 16 of the RFLAGS register. In user mode, only EFLAGS, i.e. the lower 32 bits of the RFLAGS register, are accessible. The resume flag can be set as follows, with EFLAGS being used instead of RFLAGS because of the aforementioned reasons:

exception_info->ContextRecord->EFlags |= 1 << 16;

After adding that, the code can continue execution even after a hardware breakpoint was triggered.

Forbidding IC registration

We’ve covered everything that’s needed to hinder someone from registering a new IC. The following exception handler only handles a hardware breakpoint set in Dr0. Then, NtSetInformationProcess specific actions are performed: first, we check if the 0x28, the value required to install an IC, is even passed to the function or if NtSetInformationProcess should perform something else than registering an IC. If a new IC should get installed, it is read out and printed. Afterwards, rax, the register that holds the return value, is set to 0 to show that the function call was successful. We then set rip to the address of a ret instruction, so NtSetInformationProcess isn’t executed. You could also manually set up the return, meaning manually adjusting the stack and loading the return address into rip.

long exception_handler(EXCEPTION_POINTERS* exception_info) {
if (!(exception_info->ContextRecord->Dr6 & 1))
   return EXCEPTION_CONTINUE_SEARCH;
exception_info->ContextRecord->EFlags |= 1 << 16;
// Does the call even want to overwrite the IC?
if (exception_info->ContextRecord->Rdx != 0x28)
   return EXCEPTION_CONTINUE_EXECUTION;
const auto instrumentation_info = reinterpret_cast<PROCESS_INSTRUMENTATION_CALLBACK_INFORMATION*>(exception_info->ContextRecord->R8);
std::println("Following IC was going to get set: {}", instrumentation_info->Callback);
// Success
exception_info->ContextRecord->Rax = 0;
exception_info->ContextRecord->Rip = reinterpret_cast<DWORD64>(ret_operation_addr);
return EXCEPTION_CONTINUE_EXECUTION;
}

If you installed your own IC with an exception handler, registered a hardware breakpoint on NtSetInformationProcess and then tried reregistering an IC, you would see prints by your own exception handler, which shows that the IC registration was blocked. You can verify that your IC wasn’t overwritten by trying to register a new IC multiple times: if the prints still show up, this of course means your IC is still active.

Closing words

In this blog you learned how to do very basic hooking with ICs, but this is by no means all you can do with ICs in terms of hooking. The benefit of the chosen design, i.e. your IC calling an exception handler with a set up EXCEPTION_POINTERS structure, is that it is compatible with the regular format of exception handlers required for VEH. Anything you can get to work with VEH you can get to work with the IC implementation of it, with the main benefit being that no other exception handlers are called due to the VEH being entirely skipped.

You could, for example, also hook data reads and writes by changing the hardware breakpoint options. You can also get PAGE_GUARD hooks to work, as they also throw exceptions.

We recommend keeping the restrictions of hardware breakpoints in mind, especially with multi-threaded programs.

Instead of blocking NtSetInformationProcess calls that want to register new ICs, you could block the NtSetInformationProcess call and then call the IC that should be set from within your own IC to make the user/program that tried registering the IC think their IC was successfully added, but your IC is still set, and you can filter what is passed to the other IC.

It is also possible to pass through calls to hooked functions from within your hook, but you need to disable the hardware breakpoints or pass through the exceptions to make it work as normal.

A little hint: think about the restrictions of using a flag to enable and disable your IC – what happens if someone sets a hardware breakpoint in your IC?

In the next part of this series, you will learn how you can use ICs to inject shellcode into other processes. After that, in the last part of this series, we will look at ICs from a more theoretical standpoint: what is possible with them, what isn’t and how can programs detect if an IC is set.

Further blog articles

Do you want to protect your systems? Feel free to get in touch with us.

Windows Instrumen­tation Callbacks – Part 1

Search

Windows Instrumen­tation Callbacks – Part 1

November 5, 2025

Windows Instrumentation Callbacks Part 1

Introduction

This multi-part blog series will be discussing an undocumented feature of Windows: instrumentation callbacks (ICs).

In the first part of the blog, you will learn how ICs are implemented and how you can use them to log and spoof syscalls without setting any hooks.

In the second part, you will learn how to use ICs for patchless hooking without registering or executing any exception handlers.

Disclaimer

  • This series is aimed towards readers familiar with x86_64 assembly, computer concepts such as the stack and Windows internals. Not every term will be explained in this series.
  • This blog post will teach you how to set ICs on Windows 10 and 11; for older Windows versions, the API for setting an IC is different.
  • This series is aimed at x64 programs. We will not be discussing setting instrumentation callbacks on WoW64 processes, i.e. processes running through the x86 compatibility layer.

Credits

This blog post is based on the research of multiple people, most notably Alex Ionescu and his Hooking Nirvana presentation at Recon 2015. We recommend watching that presentation as he also shows other interesting hooking techniques.

dx9’s blog post about Hyperion (an anti-cheat) and wave (a cheat), which both utilize instrumentation callbacks, was also very informative.

Additionally, we want to thank ph3r0x for telling us about ICs and about the differences in WoW64 processes.

What are instrumentation callbacks?

A callback is a function that is passed to another function which then executes the callback function at a certain event or condition.

Instrumentation refers to the process of modifying a program to allow analysis of it.

In simple terms, an instrumentation callback instruments a program so that the specified callback function is executed on kernel-to-user-mode returns. According to Alex Ionescu, instrumentation callbacks are used by Microsoft in internal tools such as iDNA, which is apparently used for time travel tracing and for TruScan. We cannot confirm that; however, there is a mention of iDNA and TruScan in this Microsoft research paper.

The more thorough explanation of the inner workings of instrumentation callbacks is as follows: ICs are a process-specific user mode callback to system traps, for example syscalls or exceptions like access violations. Once a trap is triggered, a switch to kernel mode occurs to handle the trap. If an IC is set, the kernel will return to the IC instead of the original return point. This means, the IC is the first execution step back in user mode after the trap was executed. The IC is also responsible for continuing the program flow, as otherwise the program would crash or yield. For this purpose, the kernel passes the original return point in a CPU register as we will find out by reversing later.

For visualization, let’s trace the flow of a typical Windows API call. Please note that the kernel part of this diagram is by no means complete; the diagram is meant to show the execution flow with and without an instrumentation callback; it’s not meant to teach you the inner workings of the kernel. If that interests you, we recommend the explanation of the Windows syscall handler by hammertux.

Figure 1: Exemplary OpenProcess call without IC

Consultant

Category
Date
Navigation

With an IC set, this flow would look as follows:

Figure 2: Exemplary OpenProcess call with IC

You might be wondering why we are jumping to r10. We will get to that in the next chapter.

example.exe refers to the memory region of that process; the IC does not need to be a part of the original program’s binary; it can be added dynamically at runtime.

Looking at that diagram, it might become more obvious how powerful ICs are. The kernel returns right to our code, before even the ret instruction after the syscall is executed: our IC is the first code to be executed after the kernel returns to user mode. We will discuss what can be done with that later. Let’s first check out how the IC is handled by the kernel.

Reversing

KiSetupForInstrumentationReturn

ntoskrnl.exe includes a function called KiSetupForInstrumentationReturn. Let’s check out what this function does; as one could guess by the name, it has something to do with ICs. 

mov rax, qword [gs:0x188]
mov rdx, qword [rax+0xb8]
mov r8, qword [rdx+0x3d8]
test r8, r8
jne 0x140482a86
retn

Let’s go through this step by step.

Line 1: At the start of the gs register in the kernel, the Kernel Processor Control Region (KPCR) structure is located. At an offset of 0x180 of that structure, a member structure called Kernel Processor Control Block (KPRCB) is located. So, by accessing gs:0x188, we access the KPRCB structure member at an offset of 8. At offset 8 of the KPRCB, the CurrentThread member of type KTHREAD* is located, which is dereferenced. So, after the first operation, the register rax holds the address of the start of the current thread’s KTHREAD structure.

Line 2: This operation loads the base of the KPROCESS processes into rdx. This might not fit the KTHREAD structure definition before mentioned; however, if we disassemble PsGetCurrentProcess, we will see the same operations.

Line 3-6: At an offset of 0x3d8 of the KPROCESS structure, the InstrumentationCallback member is located, which gets moved into r8 and tested to check if it is null. If it is null, the function returns. As rax still holds the the start of the current thread’s KTHREAD structure, this is what the function returns.

The following disassembly gets executed if an IC is set:

cmp word [rcx+0x170], 0x33
jne 0x14036d228
mov rax, qword [rcx+0x168]
mov qword [rcx+0x58], rax
mov qword [rcx+0x168], r8
retn

Now the parameter passed to KiSetupInstrumentationReturn in rcx is used: it’s the address of the base of the KTRAP_FRAME structure of the trap – you will just have to believe us on that one 😉

Line 1-2: This check is done to verify that the trap didn’t originate from a WoW64 program by checking the SegCs member of KTRAP_FRAME. For 64-bit programs, it should equal 0x33; for programs executed through the WoW64 compatibility layer, this is most likely 0x23. We’d recommend you check out this blog article by Marcus Hutchins if you are interested in an explanation.

Line 3-4: TRAP_FRAME.r10 is set to KTRAP_FRAME.rip. To clarify, the trap frame/the register members of that structure hold the values the thread had when the trap occurred in user mode. Meaning KTRAP_FRAME.rip does not hold a kernel address but one in userland.

Line 5: KTRAP_FRAME.rip is set to KPROCESS.InstrumentationCallback, which was already moved into r8 before.

Now we know that r10 will hold the actual instruction pointer and saw how the IC is implemented. By checking the cross-references to that function, the following functions show up: KiInitializeUserApc, KiDispatchException, KeRaiseUserException, KiRaiseException. Additionally, an unnamed function shows up. This gives us hints to what we can catch with ICs.

We now know we somehow need to set KPROCESS.InstrumentationCallback; however, this is obviously a kernel structure, which we can’t directly set from user mode.

NtSetInformationProcess

Of course there is a function to set KPROCESS.InstrumentationCallback from user mode, as otherwise this blog post would not exist. As mentioned before, we did not reverse ntoskrnl ourselves to find this function; that credit goes to Alex Ionescu.

NtSetInformationProcess is a common syscall that does multiple things; it receives the same parameters as its kernelbase counterpart SetProcessInformation. The second parameter is an enum called ProcessInformationClass that specifies the operation to execute.

With the knowledge of the Nirvana Hooking presentation by Alex Ionescu, finding the relevant code in NtSetInformationProcess is easy. Within the function, a switch case on the second parameter, the ProcessInformationClass enum, is performed. Case 0x28 is what is relevant for us to set an IC.

For brevity, we will not be going through the entirety of the function. If you are interested in looking at it yourself, you can find it in ntoskrnl.exe at NtSetInformationProcess+0x1b42.

Right after validating the passed handle, a call to PsGetCurrentProcess and SeSinglePrivilegeCheck with SeDebugPrivilege passed as parameter is made.

Then, a big if statement (NtSetInformationProcess+0x1c2b) is opened, which checks if the return value of SeSinglePrivilegeCheck is true or if an unknown variable is equal to PsGetCurrentProcess. This lets us guess we require the SeDebugPrivilege to set an IC on other processes, but we don’t need it to set it on our own process.

At NtSetInformationProcess+0x1d09, we see a familiar looking offset: 0x3d8. This is the line where our IC gets set.

This logic can be represented by the following shortened pseudo code:

struct PROCESS_INSTRUMENTATION_CALLBACK_INFORMATION {
ULONG Version;
ULONG Reserved;
PVOID Callback;
};
NTSTATUS NtSetInformationProcess(HANDLE ProcessHandle, PROCESSINFOCLASS ProcessInformationClass, PVOID ProcessInformation, [...]) {
  switch (ProcessInformationClass) {
      // [...]
      case 0x28:
          NTSTATUS status = ObReferenceObjectByHandle(ProcessHandle, PROCESS_SET_INFORMATION, PsProcessType, [...]);
          if (status < 0)
              return status;
            KPROCESS current_process = PsGetCurrentProcess();
          bool has_debug_priv = SeSinglePrivilegeCheck(SeDebugPrivilege, KPRCB[0x232]);
if (!has_debug_priv && requested_process != current_process)
              return STATUS_PRIVILEGE_NOT_HELD;
          if (IsWow64Process(requested_process))
              return STATUS_NOT_SUPPORTED;
            void* ic_address = ProcessInformation.Callback;
        // IC Sanity checks
          // [...]
        // KPROCESS structure
          requested_process.InstrumentationCallback = ic_address;
            // [...]
        }
  }

Setting up a basic IC

Now that we have partially reversed KiSetupForInstrumentationReturn and NtSetInformationProcess we know the following things:

  • An IC can be set from user mode with NtSetInfomationProcess.
    • ProcessInformationClass needs to be set to 0x28.
    • If we want to set an IC on another process, we need to have the SeDebugPrivilege.
  • When the IC is executed, r10 will hold the original rip.

For a successful NtSetInformationProcess call, the following struct needs to be passed as ProcessInformation parameter. We will also need the type definition of NtSetInformationProcess.

struct PROCESS_INSTRUMENTATION_CALLBACK_INFORMATION {
ULONG Version;
ULONG Reserved;
PVOID Callback;
};

Only the Callback member matters to us, the other two need to be set to 0. You can try setting Callback to a function pointer; however, you will not be very successful as the stack was not set up for a function call. The Callback member should instead point to some assembly code. This assembly code, which we will call the bridge, needs to do the following:

  1. Save the registers
  2. Set up a function call
  3. Restore stack and registers after function call
  4. Jump to r10 as that holds the actual address the code should resume at.

Depending on what you want to use your IC for, you will most likely trigger syscalls from within the IC itself. This would cause an infinite recursion, as the IC would be called again when the syscall is triggered; thus, we will also need an option to disable the IC for the current thread.

Let’s try setting up a very simple IC that will trigger a breakpoint on a kernel to usermode return.

Setting the IC

The following is our exemplary code to set an IC. You will of course need to have a function definition for NtSetInformationProcess.

#include <print>
#include <Windows.h>
extern "C" void instrumentation_bridge();
extern "C" void instrumentation_callback() {
  __debugbreak();
}

int main()

PROCESS_INSTRUMENTATION_CALLBACK_INFORMATION instrumentation_info{};
  instrumentation_info.Callback = reinterpret_cast<void*>(&instrumentation_adapter);
  const auto nt_set_info_proc = reinterpret_cast<NtSetInformationProcess_t>(GetProcAddress(GetModuleHandle("ntdll.dll"), "NtSetInformationProcess"));
  if (!nt_set_info_proc) {
    std::println("Could not resolve NtSetInformationProcess");
    return false;
  }
  auto status = nt_set_info_proc(GetCurrentProcess(), static_cast<_PROCESS_INFORMATION_CLASS>(0x28), &instrumentation_info, sizeof(instrumentation_info));
  if (status) {
    std::println("NtSetInformationProcess returned {:x}", status);
  } else {
    std::println("Successfully installed instrumentation callback");
  }

extern “C” is used to disable C++ name mangling and instead use C style linkage.

With the line extern “C” void instrumentation_bridge(); we are linking to our not-yet-written assembly bridge.

instrumentation_callback is the function we want to call through our assembly bridge. For now, we just set a breakpoint there, as we will not be implementing a flag to avoid recursion just yet.

Writing the assembly bridge

For writing the assembly bridge, we’ll be using NASM. If you are using MASM or another assembler, you will of course need to adjust the assembly accordingly.

We will start by pushing the registers, setting up the function call, calling it and then undoing our changes. After that, we will jump to r10 to continue the execution flow. There are multiple ways you can save the current registers, either you just push them to the stack, save them to a structure or call Windows functions doing that for you. Please note that the following snippets do not save, for example, the floating-point registers.

extern instrumentation_callback
section .code
global instrumentation_adapter
instrumentation_adapter:
pushfq
push rax
push rbx
push rcx
push rdx
push rdi
push rsi
push r8
push r9
push r10
push r11
push r12
push r13
push r14
push r15
push rbp
mov rbp, rsp
sub rsp, 0x20
call instrumentation_callback
add rsp, 0x20
pop rbp
pop r15
pop r14
pop r13
pop r12
pop r11
pop r10
pop r9
pop r8
pop rsi
pop rdi
pop rdx
pop rcx
pop rbx
pop rax
popfq
jmp r10

By running the program with an attached debugger, you should now trigger the breakpoint in the C++ code. This means, our function is correctly called. However, we obviously want to do more with our callback than trigger a breakpoint, but for that we will need to implement a check to avoid infinite recursion as the IC would be executed for every syscall, even if the syscall was made by the IC itself.

This flag should be thread-local, as otherwise we would not catch syscall executions in other threads while our IC in one thread is executing.

For this purpose, we’ll be misusing the legacy member InstrumentationCallbackDisabled of the Thread Environment Block (TEB). This is, at least in x64 versions, no longer used. There are smarter ways of implementing such a check, for example with Thread Local Storage, as using the InstrumentationCallbackDisabled member is an obvious giveaway to EDRs/ACs that something weird is going on.

If you look at the structure of the TEB, you will see InstrumentationCallbackDisabled is located at 0x1b8. The idea is that once the IC is triggered, InstrumentationCallbackDisabled gets set to 1 (true) and then our C++ function is executed. If that functions triggers syscalls, they will not call the function again because before that our assembly bridge will check if InstrumentationCallbackDisabled is set to 1 (true). If it is, it continues execution. Once our C++ function is over and the assembly bridge restores the registers, the flag will be cleared.

To do this, the following assembly can be used. The first part before the dots is meant to be added right after the pushfq, and the bottom part is meant to replace everything after pop rax.

  mov rcx, gs:[30h] ; TEB
  add rcx, 1b8h ; TEB->InstrumentationCallbackDisabled 
cmp byte [rcx], 1
  je _ret
  […]
  mov rcx, qword gs:[30h] ; TEB
  add rcx, 1b8h ; TEB->InstrumentationCallbackDisabled
  mov byte [rcx], 0
_ret:
  popfq
  jmp r10

The careful eye might’ve noticed something: with this code we are no longer backing up and restoring rcx. Why’s that?

If you attach a debugger to a program, place a breakpoint on the instruction after a syscall and trigger it, you will see the address of the instruction after the syscall being in rcx. If you do the same with an IC, you will see that the address of the IC is in rcx. If you wanted to hide the existence of your IC, this would obviously be counterproductive. Fixing this, is not part of this article and will not be covered here

We would also recommend checking the value of r10 with and without an IC set.

Logging and spoofing syscalls

Let’s recap: by now we can execute our own C/C++ function after every exception and make syscalls from within it. This is cool; however, we can’t do specific things for certain executed syscalls, as we do not have access to the executed syscalls’ address in our C++ function. Let’s fix this and while we are it, let’s pass even more parameters that will be useful to us. In total we are planning to add three parameters giving us the address of the syscall that was executed, the return value and the original stack pointer. Why the original stack pointer is interesting will be explained shortly.

As mentioned before, there are different ways of saving the registers and different ways of passing information to your function. If you saved the registers in, for example, a CONTEXT structure, you could just pass that to your IC.

Let’s first change our function definition to add the three parameters. Additionally, it would be nice to change the return value of syscalls.

Like specified in the windows x64 calling convention, return values are passed in the rax register. When a syscall is made and the IC is triggered, rax will hold the return value of the syscall. By changing the return type of the instrumentation_callback function from void to uint64_t we can easily overwrite the return value of the syscall by returning another value from our C++ code as rax is overwritten by that.

After implementing those changes, the instrumentation_callback function looks as follows:

uint64_t instrumentation_callback(uint64_t original_rsp, uint64_t 
return_addr, uint64_t return_val) {
__debugbreak();
}

Now we need to adjust the assembly bridge. We can use rcx to store the original stack pointer, as we do not need to back up rcx because of the reasons mentioned before.

extern instrumentation_callback
section .code
global instrumentation_adapter
instrumentation_adapter:
  mov rcx, rsp
  pushfq
push rcx
  mov rcx, gs:[30h] ; TEB
  add rcx, 1b8h ; TEB->InstrumentationCallbackDisabled 
cmp byte [rcx], 1
  pop rcx
  je _ret
  […]
  push rbp
  mov rbp, rsp
  sub rsp, 0x20
  ; rcx already contains the stack pointer
  mov rdx, r10
  mov r8, rax
  call instrumentation_callback
  add rsp, 0x20
  pop rbp
  […]

This should trigger the placed breakpoint in our C++ code and shows that the parameters contain the correct values.

Logging syscalls

To log syscalls with their function name, we will use the dbghelp library, which you need to link against.

Additionally, the following code needs to get added to the start of main to allocate a console and initialize the symbol handler.

[…] 
if (!AllocConsole())
    return -1;

FILE* fp;
freopen_s(&fp, "CONOUT$", "w", stdout);
freopen_s(&fp, "CONIN$", "r", stdin);
freopen_s(&fp, "CONERR$", "w", stderr);
SymSetOptions(SYMOPT_UNDNAME);
if (!SymInitialize(reinterpret_cast<HANDLE>(-1), nullptr, TRUE)) {   
std::println("SymInitialize failed");
 return -1;
  }
[…]

The following instrumentation_callback function then prints out all the called function names, their address, the displacement from the function start and the return value.

extern "C" uint64_t instrumentation_callback(uint64_t original_rsp, uint64_t return_addr, uint64_t return_val) {
std::array<byte, sizeof(SYMBOL_INFO) + MAX_SYM_NAME> buffer{ 0 };
const auto symbol_info = reinterpret_cast<SYMBOL_INFO*>(buffer.data());
symbol_info->SizeOfStruct = sizeof(SYMBOL_INFO);
symbol_info->MaxNameLen = MAX_SYM_NAME;
uint64_t displacement = 0;
if (!SymFromAddr(reinterpret_cast<HANDLE>(-1), return_addr, &displacement, symbol_info)) {
   printf("[-] SymFromAddr failed: %lu", GetLastError());
    return return_val;
}
  if (symbol_info->Name)
   printf("[+] %s+%llu \n\t- Returns: %llu\n\t- Return address: %llu\n", symbol_info->Name, displacement, return_val, return_addr);
  return return_val;
}

This functionality is obviously the most useful if the project is a DLL and not an EXE, as it can then be injected into a process to see which syscalls the program triggers.

Spoofing syscalls

Let’s now start doing cool stuff with our IC: as ICs are the first code being executed in user mode after a syscall, we can spoof its return values from our IC.

For this example, our test program will be using OpenProcess to open a handle to another process. Our IC will then retrieve the opened handle from the stack, close it and then return ACCESS_DENIED.

Our IC only gets a callback to NtOpenProcess, which is called by OpenProcess, not to OpenProcess itself. Let’s look at the function definitions for both functions:

HANDLE OpenProcess(
[in] DWORD dwDesiredAccess,
[in] BOOL  bInheritHandle,
  [in] DWORD dwProcessId
);
NTSTATUS NtOpenProcess(
[out]          PHANDLE            ProcessHandle,
[in]           ACCESS_MASK        DesiredAccess,
[in]           POBJECT_ATTRIBUTES ObjectAttributes,
[in, optional] PCLIENT_ID         ClientId
);

As we can see, rax, the register containing the return value of the syscall, will hold a NTSTATUS value and not the handle. First, we need to check if NtOpenProcess was executed without an error and then we need to retrieve the handle from the stack for which we need a stack offset.

As OpenProcess returns a HANDLE, we know the required logic to retrieve the handle is already implemented in OpenProcess after the NtOpenProcess function call.

Let’s reverse OpenProcess in kernelbase to retrieve the offset:

[…]
call qword [rel NtOpenProcess]
nop dword [rax+rax]
test eax, eax
js 0x1800338c5
mov rax, qword [rsp+0x88]
add rsp, 0x68
retn

Most of the function is not important for us; we just need to check how the handle gets loaded into rax. This is done through the operation mov rax, qword [rsp+0x88], so we know that if we have the stack pointer of the OpenProcess function, the handle is at an offset of 0x88. Our original_rsp parameter holds the stack pointer of NtOpenProcess, not OpenProcess. This means that the top of the stack holds the address NtOpenProcess should return to in OpenProcess. Therefore, we need to add eight to that value of 0x88 to access the handle.

You might understand now why we added an original_rsp parameter to our C++ function. We could still access the handle from the function with inline assembly; however, every time we add, for example, a local variable in our C++ function, we would need to recalculate our offset to the handle, as a bigger stack frame would be allocated for our function.

Let’s recap what we require to spoof the handle access:

  1. We need to calculate the return address of the NtOpenProcess
  2. We need to check if the return address is that of the ret operation of NtOpenProcess.
  3. We should check the value of rax. If it contains a non-zero value NtOpenProcess
  4. We need to change the handle at the offset of 0x90 of the original stack pointer to INVALID_HANDLE_VALUE.
  5. We need to change the return value to STATUS_ACCESS_DENIED (0xC0000022).

As we can now do this in C++, this is very easy and can be done with the following code:

extern "C" uint64_t instrumentation_callback(uint64_t original_rsp, uint64_t return_addr, uint64_t return_val) {
static uint64_t nt_open_proc;
  if (!nt_open_proc) {
   nt_open_proc =
reinterpret_cast<uint64_t>(GetProcAddress(GetModuleHandleA("ntdll.dll"), "NtOpenProcess"));
   if (!nt_open_proc)
     return return_val;
    nt_open_proc += 20;
}
if (return_addr != nt_open_proc)
   return return_val;
if (return_val != 0)
   return return_val;
auto handle_ptr = reinterpret_cast<HANDLE*>(original_rsp +  0x90);
if (*handle_ptr == INVALID_HANDLE_VALUE)
   return return_val;
  std::println("[+] IC: Detected program NtOpenProcess call: {}", *handle_ptr);
CloseHandle(*handle_ptr);
  std::println("[+] IC: Closed opened handle and spoofing Access denied");
  *handle_ptr = INVALID_HANDLE_VALUE;
  return 0xC0000022; // Access denied NTSTATUS value
}

To test this, let’s open a handle to a process with and without an IC set. For this example, we’ll be using notepad.exe as a test program. As OpenProcess requires a process ID, we have also added a basic process ID enumeration function.

#include <tlhelp32.h>
[…]
uint32_t get_process_id(const std::string_view& process_name) {
PROCESSENTRY32 proc_entry{ .dwSize = sizeof(PROCESSENTRY32) };
HANDLE snapshot = CreateToolhelp32Snapshot(TH32CS_SNAPPROCESS, 0);
  if (snapshot == INVALID_HANDLE_VALUE)
   return 0;
if (!Process32First(snapshot, &proc_entry))
   return 0;
  do {
   if (std::string{ proc_entry.szExeFile } != process_name)
     continue;
   CloseHandle(snapshot);
   return proc_entry.th32ProcessID;
} while (Process32Next(snapshot, &proc_entry));  CloseHandle(snapshot);
return 0;
}
int main()
{
PROCESS_INSTRUMENTATION_CALLBACK_INFORMATION instrumentation_info{};
instrumentation_info.Callback = reinterpret_cast<void*>(&instrumentation_adapter);
  const auto nt_set_info_proc = reinterpret_cast<NtSetInformationProcess_t>(GetProcAddress(GetModuleHandle("ntdll.dll"), "NtSetInformationProcess"));
if (!nt_set_info_proc) {
   std::println("Could not resolve NtSetInformationProcess");
   return -1;
}
  const auto pid = get_process_id("notepad.exe");
if (pid == 0) {
   std::println("Could not find notepad.exe");
   return -1;
}
  auto handle = OpenProcess(GENERIC_ALL, 0, pid);
  if (handle != INVALID_HANDLE_VALUE)
   std::println("Successfully opened process handle: {}", handle);
else
   std::println("Failed opening process handle: {}", handle);
CloseHandle(handle);
  auto status = nt_set_info_proc(GetCurrentProcess(), static_cast<_PROCESS_INFORMATION_CLASS>(0x28), &instrumentation_info, sizeof(instrumentation_info));
if (status) {
   std::println("NtSetInformationProcess returned {:x}", status);
} else {
   std::println("Successfully installed instrumentation callback");
}
  handle = OpenProcess(GENERIC_ALL, 0, pid);
  if (handle != INVALID_HANDLE_VALUE)
   std::println("Successfully opened process handle: {}", handle);
else
   std::println("Failed opening process handle: {}", handle);
CloseHandle(handle);
}

Executing the code with a working IC should result in one successful and one failed OpenProcess call if notepad.exe is running.

Of course, OpenProcess was just used as an example. This can be done with every syscall.

Closing words

In this blog you learnt how ICs work and how they can be used to log and spoof syscalls from user mode. ICs can be utilized for much more; in the upcoming blogs you will learn how to inject shellcode into other processes and how you can hook function calls with ICs to, for example, prevent users from overwriting your own IC. In a more theoretical part of the series we will discuss other use cases of ICs and possible counter measures.

Further blog articles

Do you want to protect your systems? Feel free to get in touch with us.

IOCs of the npm crypto stealer supply chain incident

Search

IOCs of the npm crypto stealer supply chain incident

September 25, 2025

A collection of IOCs regarding the npm crypto stealer supply chain incident

Regarding the Node Package Manager (npm) supply chain attack that started September 8, 2025, and affected 27 packages, we have collected and identified corresponding hashes to make them publicly available in one single place for easier access.

This blogpost exclusively relates to the Qix npm account compromise and the following compromise of multiple npm packets with a crypto stealer. It does explicitly not cover the more recent incident with an “npm worm” referred to as “Shai-Hulud”.

The following packages and versions were affected by the crypto stealer:

Niklas Vömel

Consultant

Category
Date
Package namePackage versionVulnerability identifier
@coveops/abi2.0.1MAL-2025-47025
@duckdb/duckdb-wasm1.29.2CVE-2025-59037
@duckdb/node-api1.3.3CVE-2025-59037
@duckdb/node-bindings1.3.3CVE-2025-59037
ansi-regex6.2.1GHSA-jvhh-2m83-6w29
ansi-styles6.2.2GHSA-p5rr-crjh-x7gr
backslash0.2.1GHSA-m2xf-jp99-f298
chalk5.6.1GHSA-2v46-p5h4-248w
chalk-template1.1.1GHSA-3jjr-pvq7-4jq5
color5.0.1GHSA-j8fv-6x8p-p766
color-convert3.1.1GHSA-ch7m-m9rf-8gvv
color-name2.0.1GHSA-m99c-cfww-cxqx
color-string2.1.1GHSA-3q87-f72r-3gm6
debug4.4.2GHSA-8mgj-vmr8-frr6
duckdb1.3.3CVE-2025-59037
error-ex1.3.3GHSA-5g7q-qh7p-jjvm
has-ansi6.0.1GHSA-jff9-gjh4-j359
is-arrayish0.3.3GHSA-hfm8-9jrf-7g9w
prebid-universal-creative1.17.3CVE-2025-59039
prebid.js10.9.2CVE-2025-59038
proto-tinker-wc0.1.87GHSA-h9m7-rmhq-pfgr
simple-swizzle0.2.3GHSA-wwpx-h6g5-c7x6
slice-ansi7.1.1GHSA-9xjj-cmqc-578p
strip-ansi7.1.1GHSA-vfjc-p7x3-q864
supports-color10.2.1GHSA-pj3j-3w3f-j752
supports-hyperlinks4.1.1GHSA-hggr-35mp-qcxg
wrap-ansi9.0.1GHSA-2rv4-jp6r-xgq7

While there are different writeups available, e.g. from Socket.dev, Aikido and Yara rules by Nextron Systems (Florian Roth), our experience shows that in most enterprise environments the easiest IoCs to hunt for are file hashes.
The few file hashes we were able to find online were spread across multiple platforms and didn’t include some of the file hashes we observed ourselves.

To achieve the greatest possible coverage, we compared the file hashes of the affected package versions with those of the predecessor versions to identify the files containing malicious payloads. After processing the files by actual relevance, we were left with the following list. We have uploaded the relevant files to Malware Bazaar.

We were unable to acquire the relevant files or their hashes of the packages color and @duckdb/duckdb-wasm.

IoCs

SHA256 hash Package
18c89177e52fa9b220d2a31d8b6cc600fc33c04ff6226d33baf2ef44abb0b958 @coveops/abi 2.0.1
cebbe1b84b450d66a10d9371273f4367a895d26be47e23b762647752e670b2a0 @coveops/abi 2.0.1
40efffba1cb3f5ca47e583f8f9a91d0684f11926b776bfbce1125d19c7b7e7d4 @duckdb/node-api 1.3.3
e54bae5d609ecfb6a9a3058bd4ac5553e672c054cca9dff50c24085ea911cf75 @duckdb/node-bindings 1.3.3
5da2e940ce5288dfe73deca2723544c19ce4e3dc8fe32880801c6675de12db0a ansi-regex 6.2.1
754722fa3fd7f8cd1ae5196656aa6d71d59e0915321f3da949652988f6920730 ansi-styles 6.2.2
30700331b6b08d5b6d8988af52a6ed20527a091b8f52d79ec1f2a8f9cea24657 backslash 0.2.1
d2b4a2ff532ff6d8f5213688324f1b69833efb13dc80d52692dae098f89371d8 chalk 5.6.1
4b2695e6ce5ecc24d1fb37e987ce844d7f5272d835913520096ab790bbdc9784 chalk-template 1.1.1
eefdc0454900e29788d29cdc919bc5eff37c7a936e49547518e3e14d31a1a4f8 color-convert 3.1.1
a6a1cd72fbdc883b69cd988b43e6ef836f3517c3f2903ce34b48517d164cd70d color-name 2.0.1
e8731a1fc574e511430b0a6dd01d28af2ec9528259f2a7d4d7a657af5b741c67 color-string 2.1.1
487eb25ee3da4b0c4a908be416bba551745eae20a9330e24c90daed0da2e42fa Debug 4.4.2
c2c292e6f8c31f83aed83de5568b2c549fee262402f425f6dc4f4d9e89d8f4f2 duckdb 1.3.3
84d70ba88af8790ef4943483aa198cae9e25f0be5ba878680856880ebd4240de duckdb 1.3.3
72035ac827454c84ce20919657fc49e0b49b19e00c2c627602bef77e28e64a13 error-ex 1.3.3
d2f01e17c87592838a207573db0cd475fbe70b7e3cc2bf8fb569444c47a64d74 has-ansi 6.0.1
161e91905f68da8aea108c6271936b732cc30668ad6177384b37025358fe2075 is-arrayish 0.3.3
731bc7673eb9f4809c8aa77499cac6c99db4e88e001ac06bdd59bd91f8111d50 prebid-universal-creative 1.17.3
2de3f3082395f9893b560f8260b09c2e43d5f875f41e7c10283f2afc079c5f41 prebid-universal-creative 1.17.3
99f72619c8c924b2696017b357af058e16d8c529d0e7f15841f017b385e577a1 prebid-universal-creative 1.17.3
3d0bfd9691dba156a71430d27b0220156af53c46fbcdb6887c0ae59e59561378 prebid-universal-creative 1.17.3
a453d224e7c31d9b40d46dde384f07317b3deae4ecdf9c62e7563c4c4b644023 prebid-universal-creative 1.17.3
a80f9d6010a8e930c7f99ec1c5141f953c018bb49d69f8073b21c0e2dbeb0eac prebid-universal-creative 1.17.3
88e8a47a09b2f25b1fde9a73b07d3e6569f4715c043fcd9ab756c3d2b67a832d prebid-universal-creative 1.17.3
63824e74362561e82443c754c17a602678d1ae098f47b3a02a410479f6c93f2a prebid-universal-creative 1.17.3
90ab5cce6a913c09f6c5265841de0779a63294b0631f93ed6b9a7246286e84c7 prebid.js 10.9.2
24840c7023e40e10257e4af39edc08947662e71c40fffc1aba2a4940c588ba7f prebid.js 10.9.2
d246ac0d3100182ed57e71437a26059b4debe43b4ab4c7efdf5aadf6cf935144 prebid.js 10.9.2
49dc8da16de89b42f9e149a964f8a4c574444a9e9ab407e221d640bf05988542 proto-tinker-wc 0.1.87
3dcacdcab1bd77924095b859a6074f79a505b2d29aa746003f73a876d04392a6 proto-tinker-wc 0.1.87
1cc9053d62745b5e4c1ef0f60947ed83576d3d203ca2a58aef9d0a20e988a134 proto-tinker-wc 0.1.87
2aaad37067814cc197efae927d81d0d98f218d9328959417f8d12764969f7d59 proto-tinker-wc 0.1.87
ee60d51f79f5bbed20976b66cd89777c6834a96c538419964b439102e678cde7 simple-swizzle 0.2.3
3a46b0cbc0e0e511f4b934bcdd31873aa99cbda46888021b1b1bf4094a7ce0d5 slice-ansi 7.1.1
587e834e3c25c8344adda2d94608759de0783230c5204d8806e1142b9128ee74 strip-ansi 7.1.1
2fb265403fcb35669fff4690a2b8aae8f359bed3b7eec9ed9a4bd1a23229d663 supports-color 10.2.1
a0691bee000dff602387c291db332954a414f86b7e1847e3852269a464b9f4c2 supports-color 10.2.1
19020c7ce1964761eab25e3d6e42f7e7bc5139dbb884dc65dd6c9760e3131419 wrap-ansi 9.0.1
06bf0057348d26021606941eee7338b85896f88eab3766312fa7605ac14d0f2b supports-hyperlinks 4.1.1

If you are interested in a deeper technical analysis or the related crypto addresses, take a look at the following blogpost by socket.dev: https://socket.dev/blog/npm-author-qix-compromised-in-major-supply-chain-attack.

Further blog articles

Do you want to protect your systems? Feel free to get in touch with us.

Vulnerability in Two App Studio Journey (CVE-2025-41459)

Search

Vulnerability in Two App Studio Journey (CVE-2025-41459)

Journey is a journaling app for iOS that stores personal entries and media.

Insecure authentication due to missing brute-force protection and runtime manipulation in Two App Studio Journey v5.5.9 for iOS

Insufficient authentication enforcement in local authentication component in Two App Studio Journey v5.5.9 on iOS allows local attackers to bypass biometric and PIN-based protection via repeated PIN attempts and runtime manipulation.

The application implements local 4-digit PIN and biometric authentication, but these mechanisms can be bypassed using brute-force and runtime manipulation techniques. As a result, sensitive data within the app may be accessed without valid user authentication.

We generally recommend enforcing retry limits, binding authentication to the iOS keychain, and storing all sensitive credentials within the Secure Enclave.

This vulnerability exposes private content and key material to local attackers with access to the device’s file system.

The issue remains unresolved at the time of writing, despite the releases of newer versions of the app since the responsible disclosure.

The vulnerability was not acknowledged or fixed by Two App Studio within 120 days. For this reason, we are releasing information to the public to allow affected users to protect themselves.

This security advisory covers vulnerabilities identified exclusively in the iOS version of the application. Other platforms such as Android or Windows were not tested.

CVSS Score
7.8 (CVSS v3.1) 

CVSS Vector String
CVSS:3.1/AV:L/AC:L/PR:L/UI:N/S:U/C:H/I:H/A:H

Affected Version
v 5.5.6 – v5.5.9 (latest at the time of release)

Credits
Hannes Allmann (cirosec GmbH)

Timeline

Do you want to protect your systems? Feel free to get in touch with us.

Vulnerability in Two App Studio Journey (CVE-2025-41458)

Search

Vulnerability in Two App Studio Journey (CVE-2025-41458)

Journey is a journaling app for iOS that stores personal entries and media.

CVE-2025-41458: Insecure data storage vulnerability in Two App Studio Journey v5.5.9 for iOS

Unencrypted storage in the database in Two App Studio Journey v5.5.9 for iOS allows local attackers to extract sensitive data via direct access to the app’s file system.

During an analysis of the iOS app, it was discovered that sensitive user data, including diary entries, authentication tokens, and cryptographic material, is stored unencrypted in both the app’s main SQLite database and its Write-Ahead Log (WAL) file. The WAL is a temporary SQLite file that records database changes before they are committed, often retaining sensitive data even after deletion. This exposes private content and key material to local attackers with access to the device’s file system.

We generally recommend encrypting local data using SQLCipher, storing keys securely in the iOS keychain with Secure Enclave protection, and disabling or regularly cleaning up WAL files to prevent recovery of deleted data.

The issue remains unresolved at the time of writing, despite the releases of newer versions of the app since the responsible disclosure. The vulnerability was not acknowledged or fixed by Two App Studio within 120 days. For this reason, we are releasing this information to the public to allow affected users to protect themselves.

This security advisory covers vulnerabilities identified exclusively in the iOS version of the application. Other platforms such as Android or Windows were not tested.

CVSS Score
5.5 (CVSS v3.1) 

CVSS Vector String
CVSS:3.1/AV:L/AC:L/PR:L/UI:N/S:U/C:H/I:N/A:N

Affected Version
v5.5.6 – v5.5.9 (latest at the time of release) 

Credits
Hannes Allmann (cirosec GmbH)

Timeline

Do you want to protect your systems? Feel free to get in touch with us.
Search
Search